
Featured Stocks In February’s Most Attractive/Most Dangerous Model Portfolios
Recap from January’s Picks
Our Most Attractive Stocks (-5.0%) underperformed the S&P 500 (-3.4%) last month. Most Attractive Large Cap stock Herbalife (HLF) gained 14%. Most Attractive Small Cap stock Cambium Learning Corp (ABCD) was up 12%. Overall, 17 out of the 40 Most Attractive stocks outperformed the S&P 500 in January.
Our Most Dangerous Stocks (-5.5%) outperformed the S&P 500 (-3.4%) as a short portfolio last month. Most Dangerous Large Cap stock NuVasive (NUVA) fell by 21% and Most Dangerous Small Cap Stock Barnes & Noble (BKS) fell by 20%. Overall, 22 out of the 40 Most Dangerous stocks outperformed the S&P 500 as a short portfolio in January, and 34 had negative returns.
The successes of these model portfolios highlight the value of our machine learning and AI Robo-Analyst technology, which helps clients fulfill the fiduciary duty of care and make smarter investments[1].
17 new stocks make our Most Attractive list this month and 12 new stocks fall onto the Most Dangerous list this month. February’s Most Attractive and Most Dangerous stocks were made available to members on February 7, 2018.
Our Most Attractive stocks have high and rising returns on invested capital (ROIC) and low price to economic book value ratios. Most Dangerous stocks have misleading earnings and long growth appreciation periods implied by their market valuations.
Most Attractive Stocks Feature for February: Plexus Corporation (PLXS: $57/share)
Plexus Corporation (PLXS), a small cap electronic services manufacturing provider, is the featured stock from February’s Most Attractive Stocks Model Portfolio. PLXS was also a featured addition to our Exec Comp Aligned with ROIC Model Portfolio in February 2017.
Since 2012, PLXS has grown revenue 2% compounded annually and after-tax profit (NOPAT) 10% compounded annually. This profit growth is a byproduct of PLXS’ NOPAT margin improving from 3% in 2012 to 5% over the last twelve months (TTM). The company has also improved its ROIC from 8% in 2012 to 11% TTM.
Figure 1: Plexus Revenue and NOPAT Growth Since 2012
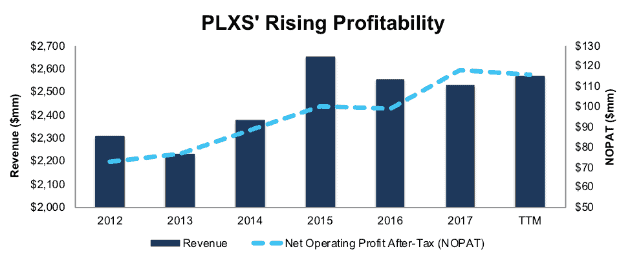
Sources: New Constructs, LLC and company filings
PLXS Valuation Provides Significant Upside
At its current price of $57/share, PLXS has a price-to-economic book value (PEBV) ratio of 1.0. This ratio means the market expects PLXS’ NOPAT to never meaningfully grow from current levels. Such an expectation seems pessimistic for a firm that has grown NOPAT by 10% compounded annually over the past five years and 6% over the past decade.
If PLXS can maintain TTM NOPAT margins of 5% and grow NOPAT by just 6% compounded annually over the next decade, the stock is worth $74/share today – a 32% upside.
Auditable Impact of Footnotes and Forensic Accounting Adjustments
Our Robo-Analyst technology enables us to perform forensic accounting with scale and provide the research needed to fulfill fiduciary duties. In order to derive the true recurring cash flows, an accurate invested capital, and an accurate shareholder value, we made the following adjustments to Plexus Corporation’s 2017 10-K:
Income Statement: we made $24 million of adjustments, with a net effect of removing $6 million in non-operating expense (<1% of revenue). We removed $9 million in non-operating income and $15 million in non-operating expenses. You can see all the adjustments made to PLXS’ income statement here.
Balance Sheet: we made $965 million of adjustments to calculate invested capital with a net increase of $19 million. One of the largest adjustments was $94 million due to goodwill. This adjustment represented 9% of reported net assets. You can see all the adjustments made to PLXS’ balance sheet here.
Valuation: we made $657 million of adjustments with a net effect of increasing shareholder value by $99 million. The largest adjustment to shareholder value was $378 million in excess cash. This adjustment represents 20% of PLXS’ market cap.
Most Dangerous Stocks Feature: Myers Industries (MYE: $20/share)
Myers Industries (MYE), plastic product manufacturer, is the featured stock from February’s Most Dangerous Stocks Model Portfolio.
Since 2012, MYE’s revenue has fallen 8% compounded annually while NOPAT has fallen 22% compounded annually to $14 million in 2016. NOPAT has fallen further to $10 million over the last twelve months. Profit decline can be attributed to MYE’s NOPAT margin falling from 5% in 2012 to below 2% TTM. The firm’s ROIC has also fallen from 6% in 2012 to 2% TTM.
Figure 2: MYE’s Revenue and NOPAT Since 2012
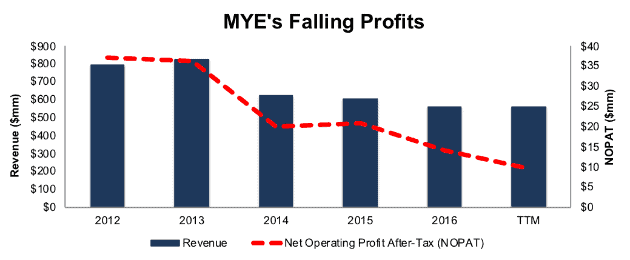
Sources: New Constructs, LLC and company filings
MYE Provides Poor Risk/Reward Tradeoff
Despite the deteriorating fundamentals, MYE is up nearly 80% over the past two years while the S&P is up just 41%. This outperformance has left MYE significantly overvalued and shares now present significant downside risk.
To justify its current price of $20/share, MYE must maintain TTM margins (2%) and grow NOPAT by 10% compounded annually for the next 20 years. This expectation seems overly optimistic given MYE’s NOPAT and margin decline over the past few years.
Even if MYE can reverse years of margin decline, achieve 4% margins (average of last five years), and grow NOPAT by 6% compounded annually for the next decade, the stock is worth just $6/share today – a 70% downside.
Auditable Impact of Footnotes and Forensic Accounting Adjustments
Our Robo-Analyst technology enables us to perform forensic accounting with scale and provide the research needed to fulfill fiduciary duties. In order to derive the true recurring cash flows, an accurate invested capital, and an accurate shareholder value, we made the following adjustments to Myers Industries’ 2016 10-K:
Income Statement: we made $29 million of adjustments, with a net effect of removing $13 million in non-operating expense (2% of revenue). We removed $8 million in non-operating income and $21 million in non-operating expenses. You can see all the adjustments made to MYE’s income statement here.
Balance Sheet: we made $300 million of adjustments to calculate invested capital with a net increase of $300 million. One of the largest adjustments was $218 million due to asset write-downs. This adjustment represented 72% of reported net assets. You can see all the adjustments made to MYE’s balance sheet here.
Valuation: we made $185 million of adjustments with a net effect of decreasing shareholder value by $185 million. There were no adjustments that increased shareholder value. The largest adjustment to shareholder value was $164 million in total debt, which includes $6 million in off-balance sheet operating leases. This debt adjustment represents 31% of MYE’s market cap.
Disclosure: David Trainer and Kyle Guske II receive no compensation to write about any specific stock, style, or theme.


