
Featured Stock In March’s Safest Dividend Yields Model Portfolio
This Model Portfolio leverages our Robo-Analyst technology[1], which scales our forensic accounting expertise (featured in Barron’s) across thousands of stocks.[2]
This Model Portfolio only includes stocks that earn an Attractive or Very Attractive rating, have positive free cash flow and economic earnings, and offer a dividend yield greater than 3%. Companies with strong free cash flow provide higher quality and safer dividend yields because we know they have the cash to support the dividend. We think this portfolio provides a uniquely well-screened group of stocks that can help clients outperform.
Featured Stock for March: Western Union (WU: $18/share)
Western Union (WU) is the featured stock in March’s Safest Dividend Yield Model Portfolio.
We made Western Union a Long Idea in September 2018, and the stock has underperformed since then (-6% vs. S&P 500 -3%). However, the fundamentals of the business have only gotten stronger.
From 2016 to 2018, WU’s revenue has grown 2% compounded annually and after-tax profit (NOPAT) has grown 4% compounded annually. During this same period, WU’s NOPAT margin increased from 15% to 16% and the firm’s return on invested capital (ROIC) improved from 21% to 27%.
Figure 1: WU’s Revenue and NOPAT Since 2016
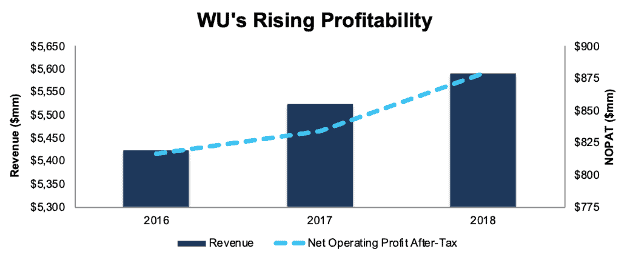
Sources: New Constructs, LLC and company filings
WU’s Free Cash Flow Supports Dividend Payments
WU has increased its annual dividend eight times over the past decade, from $0.06/share in 2009 to $0.76/share in 2018, or 33% compounded annually. WU’s current dividend equates to a 4.3% dividend yield. This increase in dividend payments has been supported by WU’s free cash flow. From 2015 to 2018, WU generated a cumulative $4.4 billion (55% of market cap) in FCF while paying $1.3 billion in dividends.
Companies with strong free cash flow provide higher quality dividend yields because we know the firm has the cash to support its dividend. On the flip side, dividends from companies with low or negative free cash flow cannot be trusted as much because the company may not be able to sustain paying dividends.
Figure 2: WU FCF vs. Dividends Since 2015
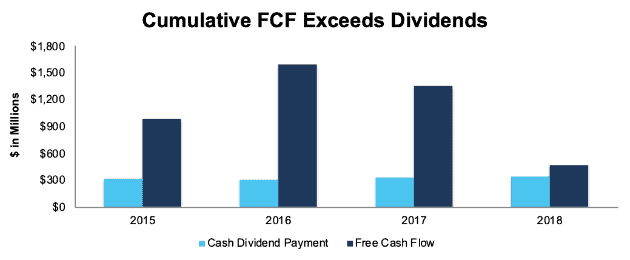
Sources: New Constructs, LLC and company filings
WU Remains Undervalued
At its current price of $18/share, WU has a price-to-economic book value (PEBV) ratio of 0.7. This ratio means the market expects WU’s NOPAT to permanently decline 30%. This expectation seems pessimistic given that WU has grown NOPAT by 4% compounded annually since 2016.
If WU can maintain 2018 NOPAT margins (16%) and grow NOPAT by just 3% compounded annually for the next decade, the stock is worth $35/share today – a 93% upside. See the math behind this dynamic DCF scenario.
Critical Details Found in Financial Filings by Our Robo-Analyst Technology
As investors focus more on fundamental research, research automation technology is needed to analyze all the critical financial details in financial filings. Below are specifics on the adjustments we make based on Robo-Analyst findings in Western Union’s 2018 10-K:
Income Statement: we made $297 million of adjustments with a net effect of removing $27 million in non-operating expenses (<1% of revenue). See all adjustments made to WU’s income statement here.
Balance Sheet: we made $2 billion of adjustments to calculate invested capital with a net decrease of $293 million. The most notable adjustment was $347 million in accumulated asset write downs, which represented 10% of reported net assets. See all adjustments made to WU’s balance sheet here.
Valuation: we made $4.8 billion of adjustments with a net effect of decreasing shareholder value by $2.9 billion. The largest adjustment to shareholder value was $3.6 billion in total debt, which includes $241 million of off-balance-sheet operating leases. This lease adjustment represents 3% of WU’s market value. See all adjustments made to WU’s valuation here.
[1] Harvard Business School features the powerful impact of our research automation technology in the case New Constructs: Disrupting Fundamental Analysis with Robo-Analysts.
[2] Ernst & Young’s recent white paper “Getting ROIC Right” demonstrates the superiority of our stock research and analytics.
Disclosure: David Trainer, Kyle Guske II, Sam McBride, Andrew Gallagher receive no compensation to write about any specific stock, style, or theme.


