
Fear Versus Data
No one likes losing. It is in our human nature to suppress our losses and focus on our wins or even to just avoid losing all together. When looking at the stock market performance, investors are frequently motivated by fear versus data. It is a known fact that investor behavior can erode as much as 4% annually from market return versus personal returns. People often ask me, how do I “Trump proof” or “Bernie proof” my portfolio? Or, how do I avoid 2008 again? The answer is fairly simple, the long-term data shows that there should be no fear, only buying opportunities based on data.
The chart below, from Morningstar Direct, provides the different ranges of the calendar year returns for the S&P 500 Index – which consists of 500 stocks of generally large US-based companies. For the 92-year period shown, the S&P 500 Index posted positive calendar year returns 74% of the time and negative calendar year returns 26% of the time, with an average calendar year return of 21% over the positive years and -14% over the negative years.
So why is everyone so fearful? When you are going through the 26% chance of a down year, it is hard to stay focused on the long-term. This causes many investors to sell at the worst times, never to recover the loss. For those that can hold out through market volatility, there historically has been greater rewards. My advice during stock market ups and downs remains the same: keep your investing cost low, maintain a diversified portfolio and focus on the long-term.
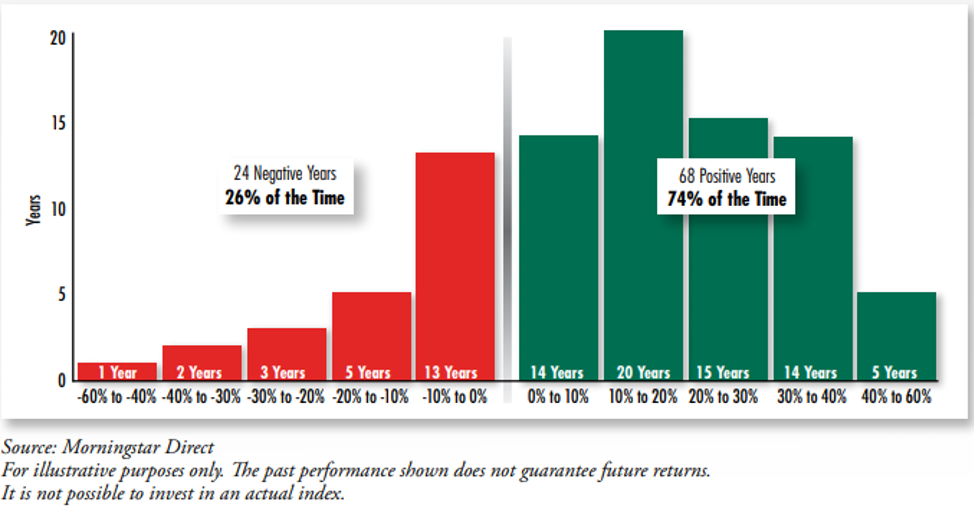
S&P 500 92 year period
Casey Smith is owner and president of Wiser® Wealth Management, a wealth management firm based in Marietta, GA. Wiser® Wealth Management helps clients identify, understand, and commit ...
more

