
Exxon Mobil : An Elliott Wave Theory Pattern To Perfection
The Elliott Wave Theory is based on the idea that the market advances in 5 waves and pullback in 3 waves. The idea has become very famous and millions of traders around the world practice it. We at Elliott Wave Forecast have been introducing new ideas to make the theory better. We developed a system in which we look at the market in corrective sequences of 3-7-11. These numbers in turn also have 3-7-11 in each sub sequence. Thus, we have a full corrective sequence of 3-7-11-15-19-23 … into the infinity. Let’s take a look at XOM (Exxon Mobil ) chart which shows a clear 5 waves or swings advance since the all-time low.
Exxon Mobil ($XOM) Quarterly Elliott Wave Chart
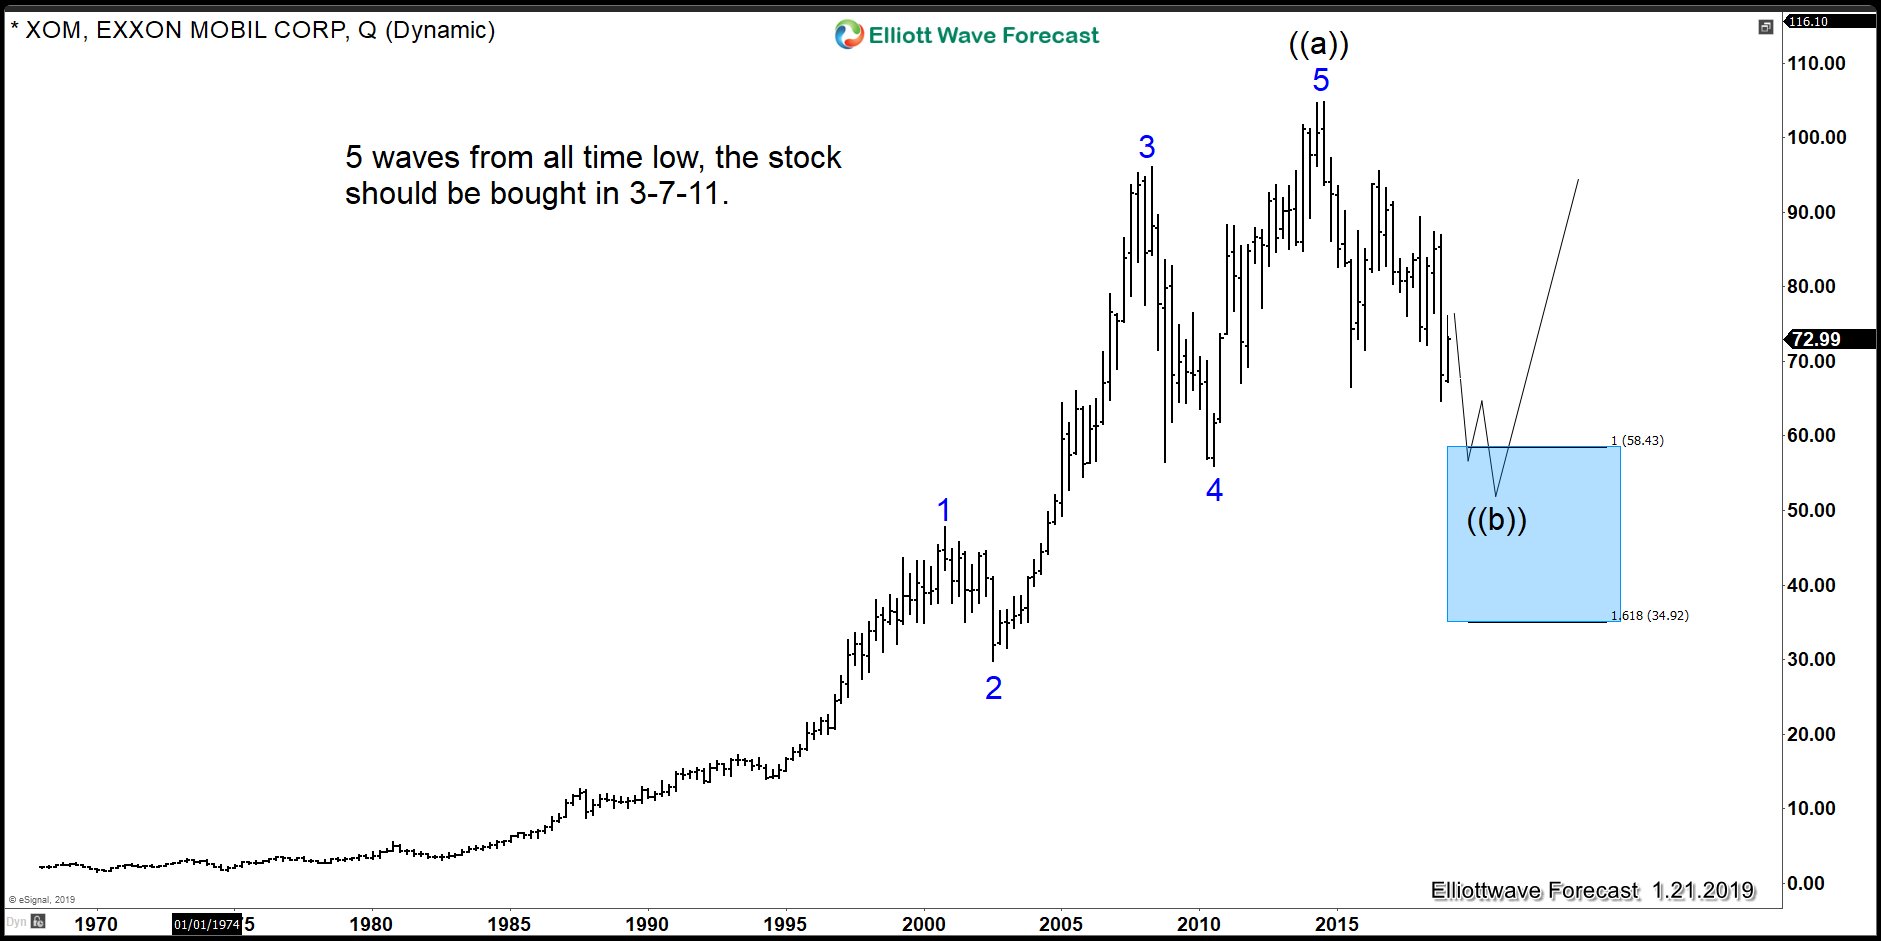
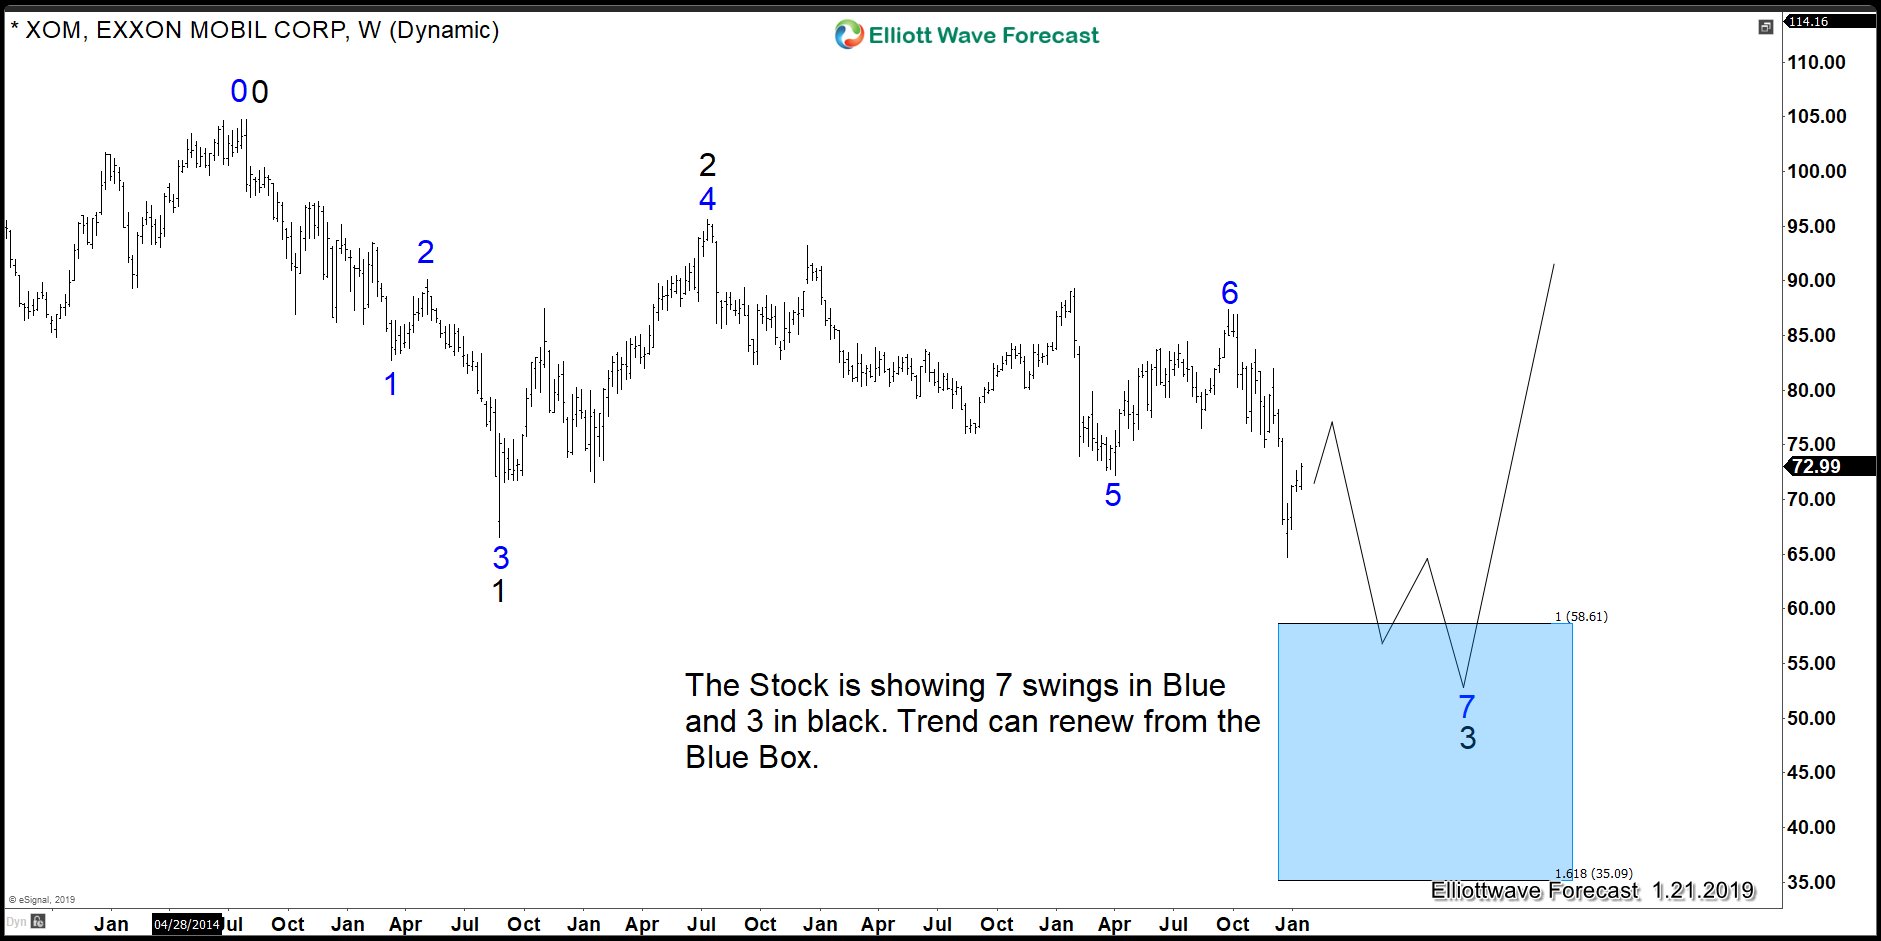
We want to make it clear that when we say 5 waves, they normally refer to the Elliott Wave 5 waves impulse / diagonal structure. However, when we say 5 swings, this can be part of a 7 swing corrective sequence (WXY). $XOM looks to rally in 5 waves (impulse) from all-time low. However, what’s interesting is that soon the stock will reach an area in which 7 swings can be complete. This area is the blue box area and it can provide an opportunity for a nice bounce or another 5 waves higher. The chart below shows 2 sequences; the lower degree in blue color and higher degree in black color. In the blue (lower) degree we will get 7 swings and in the black (higher) degree, we will see 3 swings.
Exxon Mobil ($XOM) Weekly Sequence Chart
Understanding how we trade is simple. There is a right side which in this case is the long side. The reason is because of the 5 waves advance since all time lows. Traders should buy pullback in the sequence of 3, 7, or 11 swing. We need to understand that nobody knows for sure how deep the pullback is and when the trend will renew. Consequently, understanding how corrective pullback forms in 3-7-11 sequences is the key. The chart below shows a double three Elliott Wave structure (WXY) which is by definition a 7 swing. The structure in a simple way is the combination of 2 sets of ABC connected by a 3 waves structure.
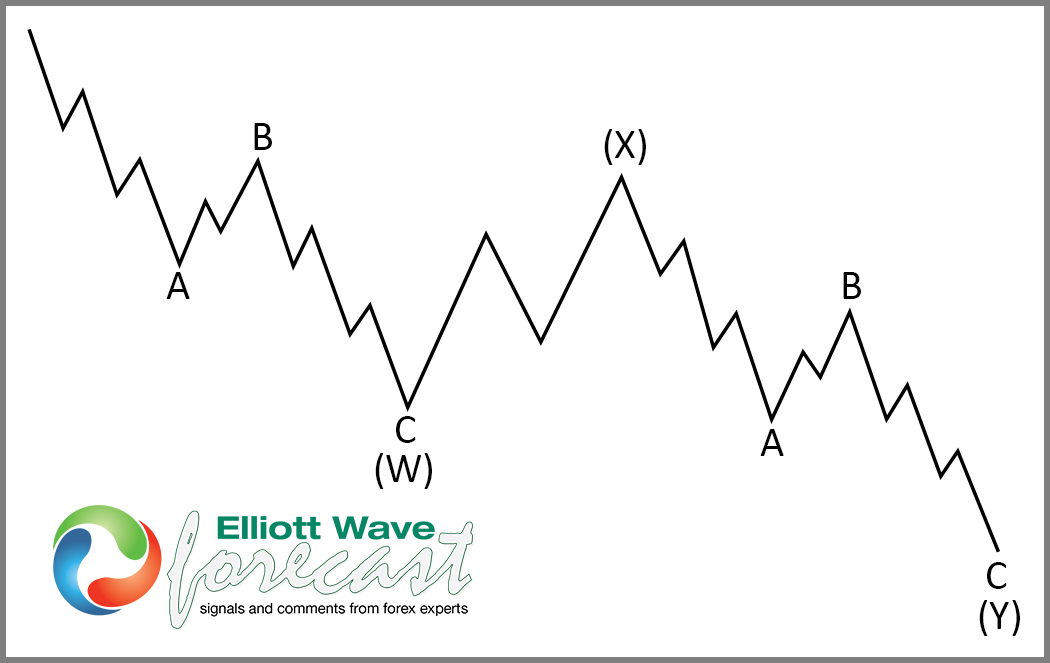
The structure very often appears across the Market and it presents a chance to buy/sell with the trend. Our ideas about sequences and cycles allow us to get the perfect timing of the Market. Most of the time the WXY ends when the W=Y related to X. With Exxon Mobil, that area will be around $57.37-33.59. Any long term buyer should buy the stock in that area.
We do understand it is a big area, but that area is a warning for sellers. The first chart above represents a 5 waves advance and the WXY correction into the proposed blue box area. As we always say, knowing the market nature is key to be professional traders. Understanding the sequences will help you get better results. The sequences in XOM is very clear and buyers will have their chance soon.
Disclaimer: Futures, options, and over the counter foreign exchange products may involve substantial risk and may not be suitable for all investors. Leverage can work against you as well as for ...
more

