
Exploration & Production Sector (XOP): 24.59% Growth For 2020 (Earnings Estimates)
(Click on image to enlarge)
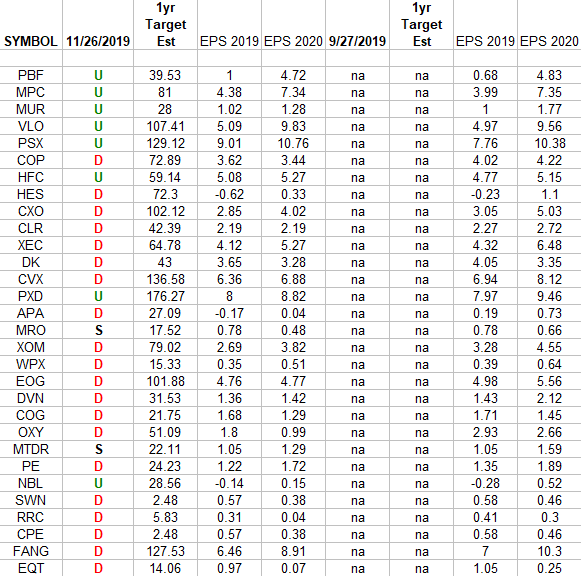
In the spreadsheet above I have tracked the earnings estimates for the Exploration & Production Sector (XOP). I have columns for what the 2019 and 2020 estimates were: 9/27/2019 and today.
The column under the date 11/26/2019 has a letter that represents the movement in 2019 earnings estimates since the most recent print (9/27/2019). “U” means 2019 estimates are UP in the last 60 days. “D” means 2019 estimates are DOWN in the last 60 days. “S” means 2019 estimates have remained the SAME in the last 60 days. The column entitled “1yr Target Est” is the Wall Street consensus 12-month price target for each stock.
What this table is telling us so far is that estimates have come down for the sector. More estimates have come DOWN for 2019 in the past 60 days than went UP – 20:8 DOWN:UP ratio.
The cumulative 2019 earnings power of the group dropped -3.59% in the last 60 days.
However, this is backward looking. 2020 Earnings Estimates for these top 30 components are expected to JUMP 24.9% over 2019. What has been the worst sector for 2019 is expected to have the highest Earnings Growth for 2020.
You can find our last two articles that covered this sector here and here.
Disclaimer: Not investment advice. For educational purposes only: Learn more at HedgeFundTips.com.


