
Everywhere You Look, You Get Mixed Signals On Twitter
I developed a couple of scans back in 2008 and the idea behind them was to find stocks that were primed for sharp short-term moves, up or down. I was specifically looking for good trade setups for option trades. I’ve been running these scans every day since and they are still a big part of my investment strategy. I have added some other tools to help me evaluate the bullish and bearish list that are produced each night, but the scans themselves are pretty much the same as they were 13 years ago.
When I ran the scans on June 9, Twitter (TWTR) appeared on the bearish list. If we look at the daily chart we see that the stock has been trending lower since peaking in late February. If we connect that high with the high from April we get a downwardly sloped trend line. I also took the liberty of drawing a parallel line that connects some of the lows from the last few months. The channel does a pretty good job of defining the overall trend for the last four months. It shows the various cycles within the overall downward trend.
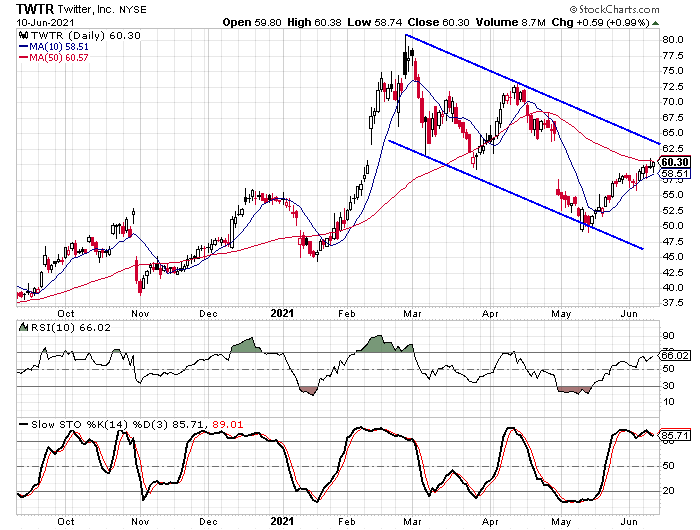
My initial thought was this looks like a good bearish setup. The stock is overbought, it is hitting resistance at its 50-day moving average, and it is just below the upper rail of the channel. But I didn’t stop there with my analysis. I also looked at the weekly chart and what I saw painted a different picture entirely.
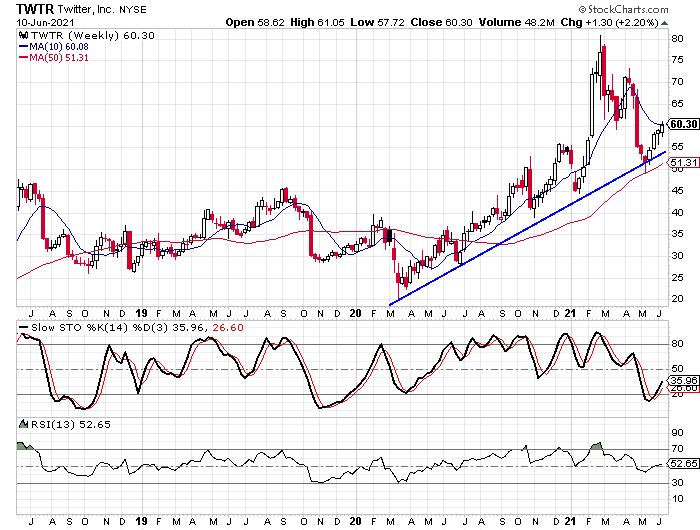
The weekly chart shows an upward trend that started with the low from March 2020 and connects with the low from last June to form a trend line. The stock dropped below the trend line in May but didn’t close a week below it. Now the stock has rallied over the last four weeks and it looks like the trend is still in place.
We also see that the stock was oversold based on the weekly stochastic indicators and they have since made a bullish crossover.
Turning to the Fundamentals for Clarification
One of the things that I have added to analyzing my scan results is looking at the fundamental indicators as well as the technical indicators. Because of the mixed outlooks from the daily and weekly charts I was especially interested in the fundamentals for Twitter. I went to Tickeron’s Fundamental Analysis screener and low and behold I saw mixed signals there as well. The artificial intelligence trend predictor showed a bullish signal for the next week and a bearish signal for the next month.
(Click on image to enlarge)

As you can also see there are three fundamental indicators that are positive and two that are negative. The company scores well in the Outlook Rating, the Profit vs. Risk Rating, and the Seasonality Score. The negative marks are in the Valuation Rating and the SMR Rating. Personally, I use the SMR rating on a regular basis and give it a little more weight than most of the other ratings. Twitter is pretty bad at 94—the best score is 1 and the worst is 100.
Looking at the indicators that help make up the SMR rating, Twitter lost money over the past year and therefore its return on equity is -12.8% and its profit margin is -26.9%. Sales have increased by an average of 13% per year and that likely kept the SMR rating from being 100.
If you look at the technical analysis score we also see three bullish signals and two bearish signals—yet another mixed group of signals. The bullish signals come from the RSI, MACD, and Momentum indicators, but they are all 14 trading days old or more. The RSI signal came 17 trading days ago. The bearish signals come from the AROON indicator and the Bollinger Bands. Both of the bearish signals came 12 trading days ago.
One indicator that hasn’t tripped a bearish signal yet is the daily stochastic readings. You can see on the daily chart that the indicators have been in overbought territory since May 24. With the stochastics in mind and the age of the bullish signals, I wouldn’t be surprised if the technical analysis score flips a little in the coming days.
Even the Sentiment Indicators are Mixed
With the charts and fundamentals sending mixed signals, it wasn’t a big surprise to see that the sentiment indicators are mixed as well. Analysts are pretty bearish on the stock and short-sellers are more bullish on Twitter than the average stock.
There are 40 analysts covering the stock currently with 10 “buy” ratings, 27 “hold” ratings, and three “sell” ratings. This gives us a buy percentage at 25% and that is considerably lower than the average stock’s buy percentage. The average buy percentage falls in the 65% to 75% range.
Of course with the buy percentage being so low and signaling extreme bearish sentiment, the short-interest ratio is extremely low and indicates bullish sentiment. The current reading on the ratio is 1.1 while the average ratio is usually in the 3.0 range. It is also worth noting that the number of shares sold short dropped from 25.2 million at the end of April to 20.2 million at the end of May. This suggests that the bullish sentiment is growing—or at least the bearish sentiment is declining.
What to Do With Twitter
Given the mixed signals from all three analysis styles, I would give Twitter a neutral rating. In the short-term outlook, the daily chart stands out to me as a red flag and I can see the stock moving lower over the next few weeks. We could see it drop back down to the upwardly-sloped trend line we see on the weekly chart and that would mean a decline of approximately 10%.
Even if the stock does drop down to the support, I’m not entirely sold on Twitter as a long-term holding. The fundamentals aren’t as strong as what I look for in stocks that I am looking to hold long-term. I like stocks that have an SMR rating of 33 or better and the higher the better.
As for the sentiment indicators, the buy percentage from analysts is encouraging, but I wouldn’t look for a bunch of upgrades all at once. Of all the sentiment indicators, the one that is the slowest to change is the buy percentage. The short-interest ratio is constantly changing so it’s possible that it will increase in the coming months, but I don’t expect it to jump to an overly high level.
All in all, I look for a short-term pullback in the stock and a neutral rating for the long term.


