
Euphoria Limited To U.S. Stocks
The Redbook same-store sales growth reading in the first week of June was one of the only indicators that showed a weakening trend. In the week of June 13th, same-store sales growth improved from -9.7% to -8.3%. The first week of June had one of the worst declines in the history of this survey. This result is mildly better.
As you can see from the chart below, Chase card spending growth like that of Mastercard and Visa showed continued improvement in growth.
JPMORGAN: “.. our own internal Chase Credit Card data [has] made a sizable step up in recent days ... and there has been a notable narrowing of some of the geographic divergences, with New York accelerating over the past week relative to other high-population states.” pic.twitter.com/QkSY3La6Zc
— Carl Quintanilla (@carlquintanilla) June 17, 2020
This chart highlights New York which had been lagging because it was shut down. Phase 2 of the reopen hasn’t started, but the difference between New York and the rest of the country has shrunk. That has helped NY catch-up to the rest of the country. The opening of the last states still closed is providing a further boost to consumer spending growth. New York has been very successful at stamping out the virus which makes sense because it had the greatest loss of life. Politicians are much more cautions there. The 7 day average of daily new cases has fallen from 1,886 on May 26th to 732 on June 16th. New York never leads the pack on new cases per day anymore.
On the other hand, the other states listed in this chart are seeing an uptick in new cases. So far, this uptick hasn’t caused consumer spending growth to fall yet. Shutdowns would definitely change that quickly. Texas is in the worst situation as the 7 day average of new cases spiked from 1,575 on June 9th to 2,400 on the 16th. In Florida, we’ve seen an increase in cases in people under 50 as opposed to people over 50. Younger people are taking more risks probably because they have a lower chance of dying. We will see in the next few weeks if this strategy works out. The national deaths per day has remained low. Florida had 55 new deaths on June 16th. The 7 day average of deaths hasn’t spiked with cases. Deaths lag cases, but even with that in mind, deaths haven’t risen as fast as you’d expect (7 day average of new cases started spiking in early June).
The Rich See A Greater Decline In Spending
As we mentioned in an article a few weeks ago, the rich saw a greater decline in spending growth than the poor. That’s because the rich have more discretionary spending that can be easily taken back. Plus, low-income workers received more income in many cases because of unemployment insurance.
(Click on image to enlarge)
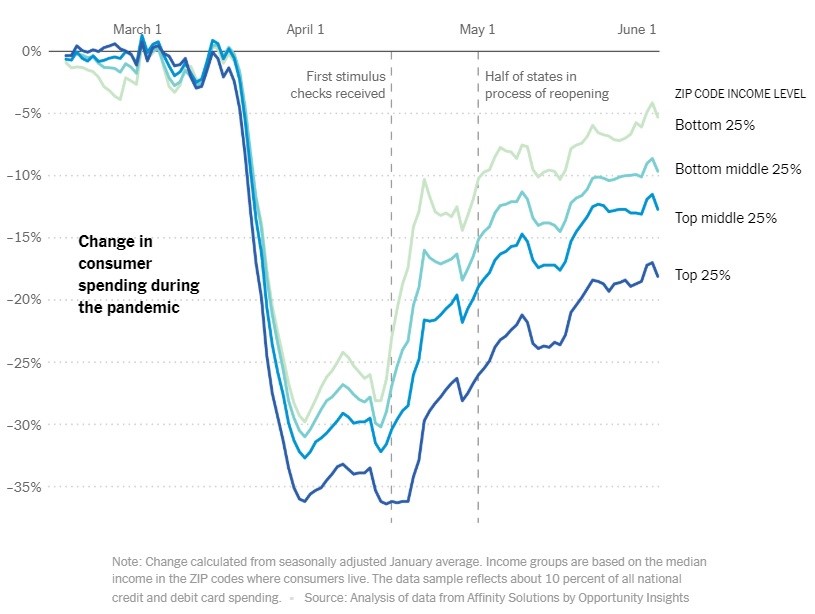
As you can see from the chart above, those living in the top 25% of zip codes by income are still seeing a high teens decline in spending. That has a disproportionate impact on overall sales, especially in the hard-hit areas like travel and leisure. Make sure to note that this chart doesn’t mean the rich are being hurt by this crisis. They are in fine shape relative to the poor especially considering the big spike in stock prices.
Massive Retail Sales Beat
Even before this retail sales report, the surprise index hit the highest reading ever; it was started in 2003. This means economic data beat estimates by the most since at least 2003. Economists may have expected the recovery to fully start later or expected a softer rebound (or both). The retail sales report had a huge beat, but these results need to continue for there to be an actual V-shaped recovery. This is just step one of many.
(Click on image to enlarge)
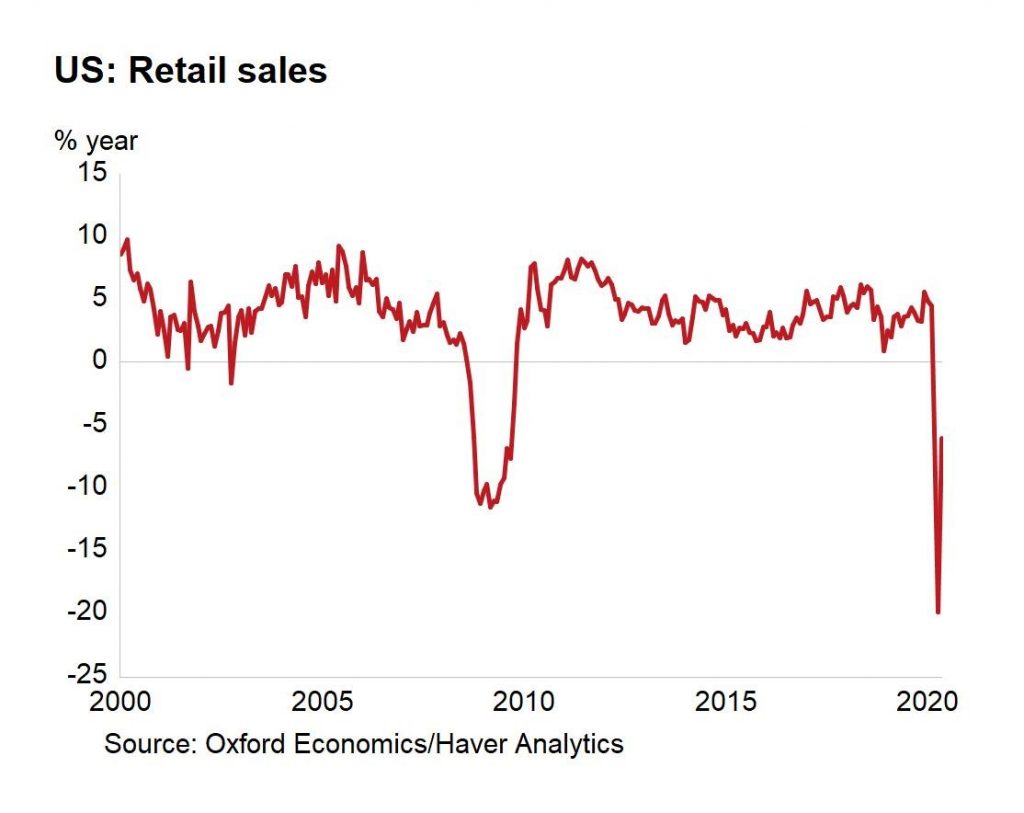
May monthly retail sales growth improved from -14.7% to 17.7%. That destroyed estimates for 7.5% even though the April growth rate was revised up 1.7%. Higher revisions make for tougher comparisons. As you can see from the chart above, yearly growth was still weak as it was -6.1%. We’ve only recovered a little above the trough in the last recession. Growth went from depressionary to recessionary. Clothing and accessory retail sales are still 63.3% below its February reading. Non-store retail sales is actually 25.4% above the February level. That’s because of the shift to online shopping. The control group had 10.6% monthly growth which destroyed estimates for 4% growth even though April’s rate was revised up from -15.5% to -12.6%.
Hedge Funds Are Very Long
According to the June fund managers’ survey by Bank of America, cash balances fell from 5.7% to 4.7% which was the biggest drop since August 2009. It’s not retail traders pushing the market higher; it’s rich investors. The last leg of the rally has been performance chasing as managers were caught with too little in U.S. stocks in May. They looked bad to their investors after the rally since late March, so they recently have been buying at any price.
As you can see from the chart below, hedge fund net equity exposure increased from 34% to 52% which is the highest since September 2018. Following that reading, stocks corrected 20%.
Not to be out-done by the robin hoard, hedge funds have apparently ramped up net-exposure to equities pic.twitter.com/9F86DdakHA
— Callum Thomas (@Callum_Thomas) June 16, 2020
It’s ironic that managers have gone so long because these same managers think stocks are overvalued. A record net 78% of managers said the stock market is overvalued. This indicator goes back to 1998 which means it includes the peak of the tech bubble.
It’s interesting that only 18% of fund managers think there will be a V-shaped recovery. This is the definition of holding your nose and buying stocks. That analogy means managers are buying even though they don’t fully believe in the bull case. As you can see from the chart below, mangers are overweight U.S. stocks, not global equities. They are underweight emerging markets and overweight cash. That’s using the Z-score of positioning in June versus history.
— ukarlewitz (@ukarlewitz) June 16, 2020
Conclusion
The consumer is showing improvement, especially in New York which has partially reopened. The retail sales report beat estimates dramatically as economists either underestimated the recovery or thought it would start in earnest later. Retail traders aren’t driving the market higher; it’s fund managers. They were caught underweight U.S. equities in May even though the stock market has rallied significantly off the March 23rd low. In the past few weeks, they have chased stocks. They are very long even though more think the market is overvalued than in the late 1990s which was the most expensive market ever. To be clear, retail trading activity is a signal of exuberance (it just doesn’t move prices).
Disclaimer: Please familiarize yourself with our full disclaimer here.


