2020 was a year for the history books – especially from a finance perspective. With COVID-19 ripping throughout the globe, we saw equity markets decline rapidly as several countries closed their borders. At the same time, however, we saw some companies flourish as people spent more time at home. Companies like Apple, Microsoft, and Google1 shined brightly and became larger than ever before. Central banks globally introduced measures that aided this appreciation by reducing rates to record lows, fueling most growth-oriented stocks upward at a rapid pace.
However, over three months into 2021, we are now seeing signs of recovery towards normalcy, with continued supportive measures by many central banks and governments, along with a growing number of people being vaccinated.
So, what does that look like from a market leadership perspective? As the recovery unfolds and economic activity accelerates, we would expect market leadership to align with that of the left column of the chart below.
(Click on image to enlarge
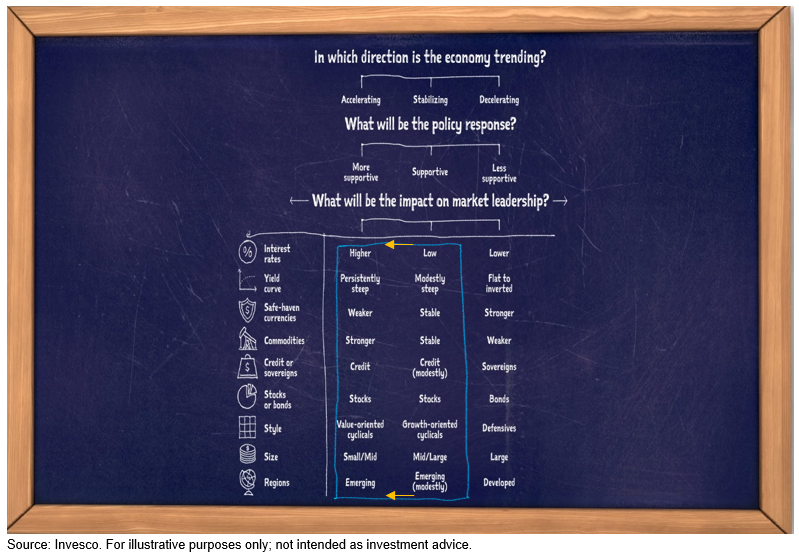
We have already seen a steepening yield curve with longer-dated bond rates rising – this could temper the strong run-up in growth-oriented stocks. Near the end of last year, the move from growth stocks to more value-oriented cyclical stocks, and the move from large-cap stocks to small/mid-cap stocks started to occur. Many of these stocks, especially names in the S&P 500®, will tend to benefit more from the economy and society reopening.
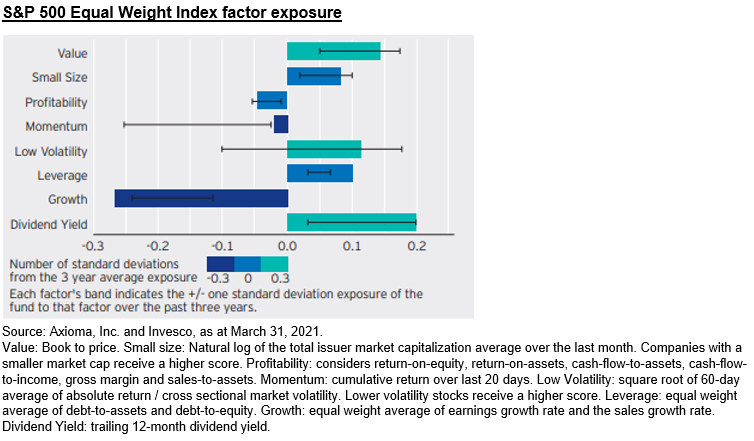
We take a look at the S&P 500® Equal Weight Index with respect to this reopening and potential for economic recovery. By equal-weighting the S&P 500®, one aims to remove the biases to the mega-cap names (like Apple, Microsoft, Google) and allocates more to the rest of the index constituents. This inherently gives more exposure to the smaller names in the S&P 500®, along with increased exposure to value-oriented sectors.
(Click on image to enlarge)
Historically, equal-weight indexing has provided outperformance during periods of recovery, relative to the broader market-cap-weighted S&P 500® Index. In significant down periods, like the global financial crisis and tech bubble, the S&P 500® Equal Weight Index saw significant outperformance after the trough.
(Click on image to enlarge)
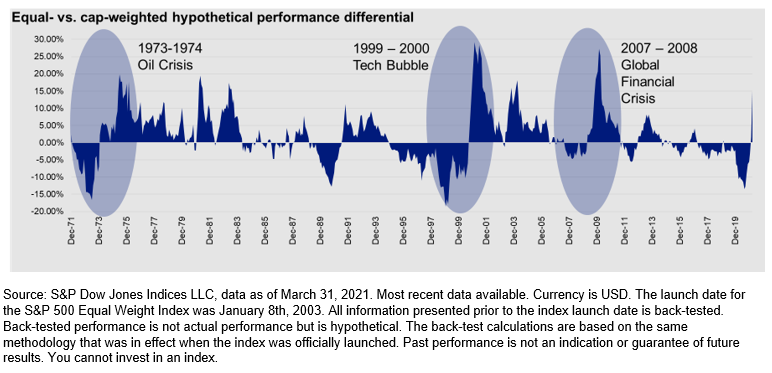
The chart above shows historical 12-month rolling excess return of the S&P 500® Equal Weight Index and the S&P 500 ® Index. After the significant decline from the tech bubble and global financial crisis, the S&P 500 ® Equal Weight Index showed significant excess return, as cyclical stocks, along with smaller names in the index, outperformed the mega-cap stocks in the index.
1 The above companies were selected for illustrative purposes only and are not intended to convey specific investment advice.
Disclaimer:
Commissions, management fees and expenses may all be associated with investments in exchange-traded funds (ETFs). Unless otherwise indicated, rates of return for periods ...
more
Disclaimer:
Commissions, management fees and expenses may all be associated with investments in exchange-traded funds (ETFs). Unless otherwise indicated, rates of return for periods greater than one year are historical annual compound total returns including changes in unit value and reinvestment of all distributions, and do not take into account any brokerage commissions or income taxes payable by any unitholder that would have reduced returns. ETFs are not guaranteed, their values change frequently and past performance may not be repeated. There are risks involved with investing in ETFs and mutual funds. Please read the prospectus before investing. Copies are available from Invesco Canada Ltd. at www.invesco.ca.
Limitations on use of hypothetical data: Performance data for the period before the creation date for the relevant index has been reconstructed and is calculated on a basis consistent with each index’s current basis of calculation. An investor cannot invest directly in an index. Performance for an index does not reflect fees and expenses that might be applicable to a fund. The hypothetical performance data for these Indices should not be taken as indicating that if the Index had, in fact, existed during the shown time periods, that this index would have achieved the hypothetical results shown. Actual results might have differed from the shown results.
The views expressed on this document are based on current market conditions and are subject to change without notice; they are not intended to convey specific investment advice. Forward-looking statements are not guarantees of future results. They involve risks, uncertainties and assumptions, there can no assurance that actual results will not differ materially from expectations. Diversification does not guarantee a profit or eliminate the risk of loss. Investments cannot be made directly in an index.
There are risks involved with investing in ETFs. Please read the prospectus for a complete description of risks relevant to the ETF. Ordinary brokerage commissions apply to purchases and sales of ETF units.
Most Invesco ETFs seek to replicate, before fees and expenses, the performance of the applicable index, and are not actively managed. This means that the sub-advisor will not attempt to take defensive positions in declining markets and the ETF will continue to provide exposure to each of the securities in the index regardless of whether the financial condition of one or more issuers of securities in the index deteriorates. In contrast, if an Invesco ETF is actively managed, then the sub-advisor has discretion to adjust that Invesco ETF’s holdings in accordance with the ETF’s investment objectives and strategies.
The S&P 500® Equal Weight Index (in this section referred to as the “Index”) is designed to track the equally weighted performance of the 500 companies in the S&P 500®. The S&P 500® is a capitalization-weighted index that is used as a benchmark of the large cap U.S. equity market. The Index has the same constituents as the S&P 500®; however, the S&P 500®’s constituents are weighted by market capitalization, while each company is allocated a fixed weight of 0.20% at each quarterly rebalancing of the Index. The Index is rebalanced quarterly to coincide with the quarterly rebalancings of the S&P 500®. The Index is rebalanced quarterly and weighted so that each company in the Index is assigned an equal weight of 0.20%.
S&P®, S&P 500® and S&P 500® Equal Weight Index are registered trademarks of Standard & Poor’s Financial Services LLC and have been licensed for use by S&P Dow Jones Indices LLC. The S&P Equal Weight Index is a product of S&P Dow Jones Indices LLC and has been licensed for use by Invesco Canada Ltd. This Invesco ETF is not sponsored, endorsed, sold or promoted by S&P Dow Jones Indices LLC, and S&P Dow Jones Indices LLC makes no representation regarding the advisability of investing in such a product.
Invesco® and all associated trademarks are trademarks of Invesco Holding Company Limited, used under license.
Invesco Canada Ltd., 2021
NA3631
Copyright © 2021 S&P Dow Jones Indices LLC, a division of S&P Global. All rights reserved. This material is reproduced with the prior written consent of S&P DJI. Please read our Disclaimers.
For more information on S&P DJI please visit https://us.spindices.com/. For full terms of use and disclosures please visit https://us.spindices.com/terms-of-use/
less
How did you like this article? Let us know so we can better customize your reading experience.


