
Energy Stocks Preparing A Bounce
2016 was a good year for Energy Stocks as Oil & GAS price rose significantly helping the Energy sector to recover from the drop that started since 2014. However since the recent peak early this year, Oil price stabilized in a tight range and failed to move higher before the recent 9% drop last week in both Brent Crude and West Texas Intermediate.
Related stocks that established a bullish reversal last year extended their correction lower but Elliott Wave technical analysis is pointing to an important areas where a bounce higher can be seen in the near term. The coming move will be also supported by an expected bounce in Crude Oil that will help these stocks to find a floor for the recent decline.
Energy Stocks Elliott Wave View
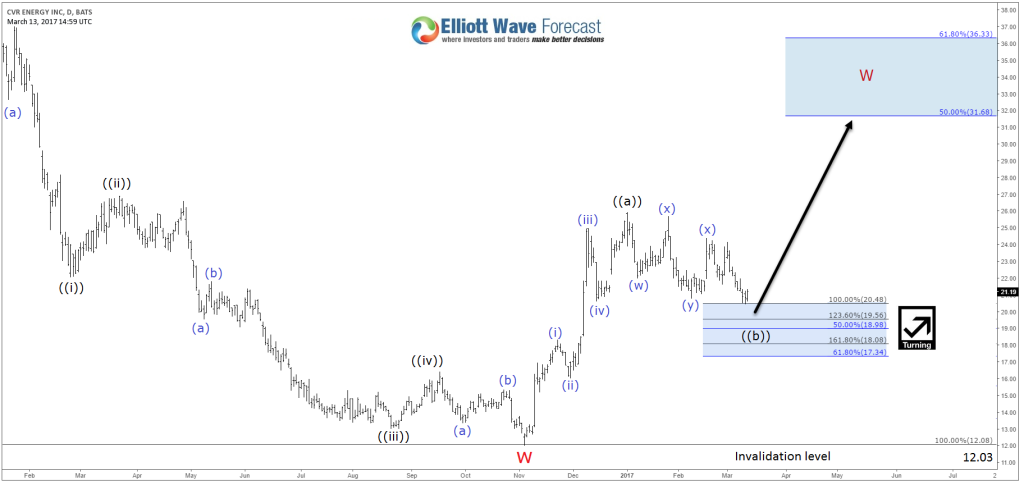
CVR Energy (NYSE: CVI) is currently correcting the bullish 5 waves cycle from November 2016 low as a triple three structure reaching equal legs area $20.48 – $19.56. The move can extend lower toward the 50%-61.8% Fibonacci area ( $18.98 – $17.34 ) as a double three but will remain supported as the stock is still looking for a move higher toward at least $31 to finish 3 waves correcting 2014 cycle. If the stock fails to make new highs after bouncing from the current inflection area, then the pullback can extend lower against $12.03 low which should hold to allow CVI to the resume higher later on.
(Click on image to enlarge)
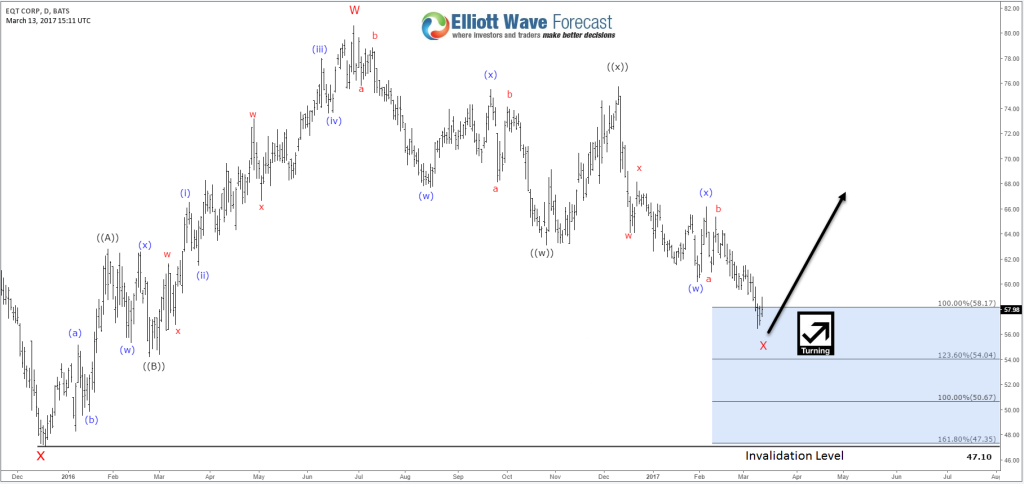
EQT Corporation (NSYE: EQT) failed to make new highs and it’s now doing a double three correction from June 2016 peak which already reached the extreme area at $85.17 with enough number of swings to end that cycle. However, in the short term, the stock can still extend toward the equal legs area $50.67 from December 2016 peak before buyers show up to resume the rally or bounce in 3 waves at least while holding above $47.10 low
(Click on image to enlarge)
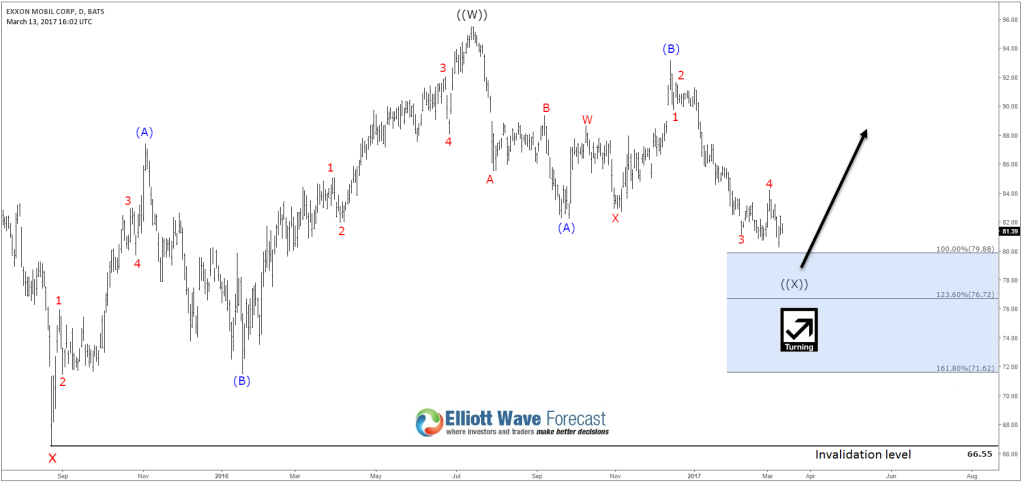
Exxon Mobil (NYSE: XOM) is still correcting an older cycle from August 2015 doing a Flat structure from July 2016 peak and currently at the last leg of wave (C) that could ideally reach the equal legs area $79.88 – $76.72 before the stock start bouncing in 3 waves at least. The flat structure is tricky because it can always extend but XOM needs to hold above $66.55 to continue its multi-year bullish trend.
(Click on image to enlarge)
Recap:
Energy Stocks approaching a technical area where Elliott Wave analysis is pointing to a potential recovery in the coming weeks that will be supported by a rise in Oil prices. The Energy sector still needs a clear break above the recent peaks to confirm a bigger move to the upside that will help these stocks for further gains.
Disclosure: None.


