
Endava - Chart Of The Day
Summary
- 100% technical buy signals.
- 11 new highs and up 8.18% in the last month.
- 61.03% gain in the last year.
The Barchart Chart of the Day belongs to the technology services company Endava (NYSE: DAVA). I found the stock by using Barchart's powerful screeners to sort for stocks with over $100 million capitalization that have the highest Weighted Alpha and technical buy signals. I sorted that list by the most frequent number of new highs in the last month, then used the Flipcahrt feature to review the charts for consistent price appreciation. Since the Trend Spotter signaled a buy in 9/17 the stock gained 2.85%.
Endava plc provides technology services for clients in the consumer products, healthcare, logistics, and retail verticals in Europe, Latin America, and North America. It offers technology and digital advisory services for financial services, healthcare, manufacturing, retail and consumer, business and support services, and TMT sectors; IT strategies; business analysis services in payments, financial services, asset and wealth management, insurance, telecommunications, and digital media areas; program management services; digital product strategy services; and architecture, extended reality, machine learning and artificial intelligence, product design, and user experience and visual design services. The company also engages in the identifying, defining, and embedding collaborative data and analytics; and provision of automated testing, cloud-native software engineering, continuous delivery, distributed agile delivery, intelligent automation, secure development, agile applications management, cloud infrastructure, DevSecOps, service delivery, smart desk, and telemetry and monitoring services. The company was founded in 2000 and is headquartered in London, United Kingdom.
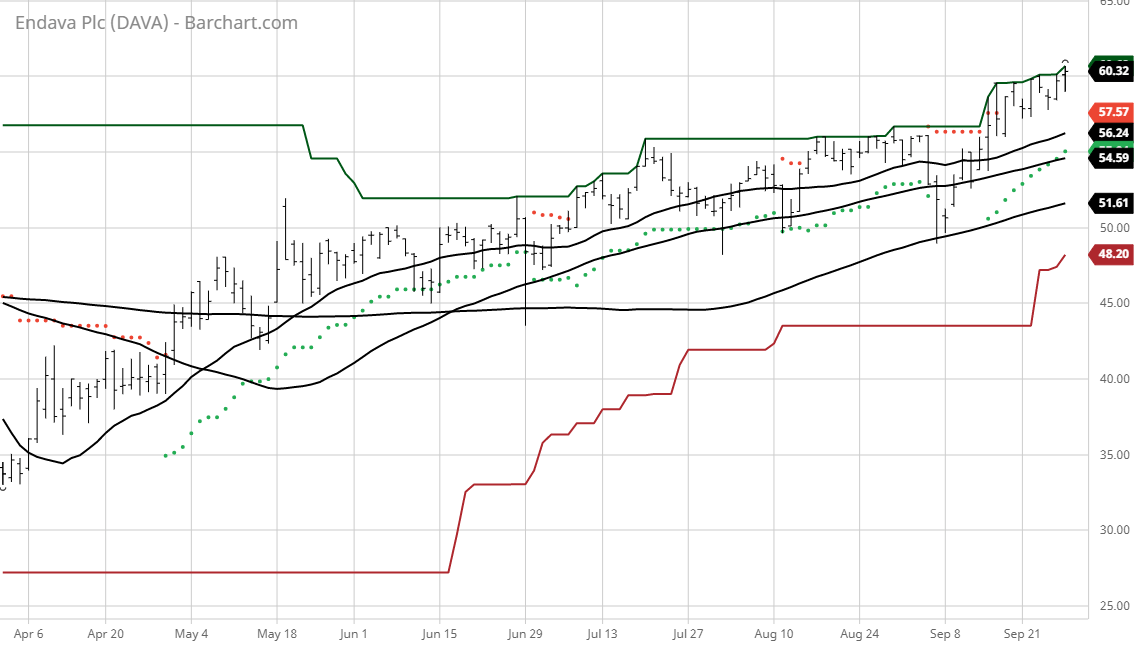
(Click on image to enlarge)
Barchart's Opinion Trading systems are listed below. Please note that the Barchart Opinion indicators are updated live during the session every 10 minutes and can therefore change during the day as the market fluctuates. The indicator numbers shown below therefore may not match what you see live on the Barchart.com website when you read this report.
Barchart technical indicators:
- 100% technical buy signals
- 76.95+ Weighted Alpha
- 61.03% gain in the last year
- Trend Spotter buy signal
- Above its 20, 50 and 100 day moving averages
- 11 new highs and up 8.18% in the last month
- Relative Strength Index 63.27%
- Technical support level at 59.32
- Recently traded at 60.32 with a 50 day moving average of 54.59
Fundamental factors:
- Market Cap $3.17 billion
- Revenue expected to grow 19.10% this month and another 22.70% next month
- Earnings estimated to increase 1.00% this month, an additional 26.60% next year and continue to compound at an annual rate of 10.34% for the next 5 years
- Wall Street analysts issued 5 strong buy, 1 buy and 3 hold recommendations on the stock
- The individual investors following the stock on Motley Fool voted 67 to 0 that the stock will beat the market
- 1,370 investors are monitoring the stock on Seeking Alpha
Disclosure: None.


