
Encouraging Market Movement
A short-term uptrend began on Aug. 20, and so far it's been a very nice move higher. Also, the PMO index reached down to the bottom of its range in both July and August, and now looks like it might be ready to reach all the way back up to the top of its range.
This is encouraging after quite a few months where the market flip-flopped and rotated between sectors which prevented the indicator from reaching the top and bottom of its range where the best market timing signals occur.
After warning for weeks about the market risks, I have now gone from short-term bear to short-term bull in just a few days because the market internals improved quite a bit. New lows dropped down to less alarming levels, junk bonds broke to new highs, small-caps rallied nicely, and leading stocks are breaking out and following through to higher highs. Bullish market behavior.
I am sure it is frustrating to see me jump ship so quickly from bear to bull, but I'm in this to make money, so I have to be flexible. When I am wrong, I have to admit it and move quickly to get myself straight with the market. And now? I am a bull until the market internals weaken again, and I am looking forward to getting back to what I do best, which is to buy stock at the PMO lows and then take partial profits at the PMO highs.

The major indexes all had strong closes and ended the week well above their 5-day averages. The indexes are favoring higher prices, and I am guessing that this short-term rally will last at least another couple of weeks. With that in mind, my accounts are fully invested to take advantage of the short-term uptrend.

The bullish percents are very much in sync with the strong price rally of the major indexes. The price action of the indexes is confirmed by the bullish percents in the chart below, and they look like they have plenty of room to run higher from here.

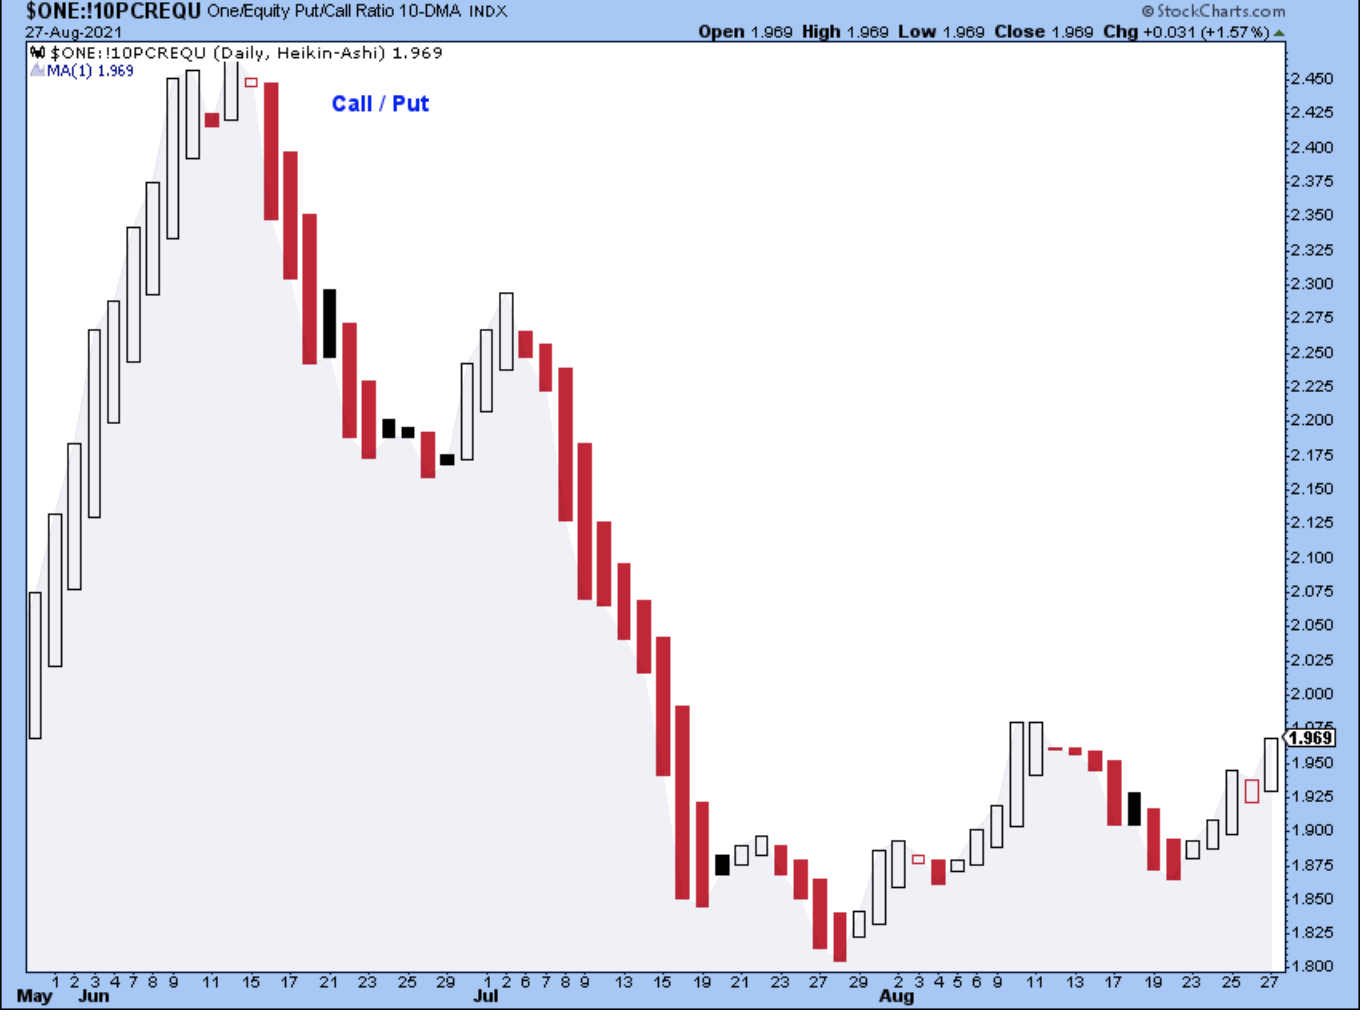
The Call/Put index is rising again after basing for a number of weeks. This is a modestly bullish chart, but it would be nice to see this index start to move sharply and consistently higher as it did in May.
The upward slope of the narrow leading indexes has been confirmed by a similar slope of their AD lines, very bullish looking.

The choppy and weak look of the broader leading indexes has been confirmed by the similar look of their AD lines. Clearly, the larger stocks have been the better performers. Now, we need to see this chart start to show a steady upward direction.

The number of new lows has dropped down which is bullish for stocks, but it could still be better such as in June. For now, though, the trend is for fewer new lows which is a bullish trend. However, I'm watching this every day to make sure we don't see another spike in new lows.

Last week I showed the shorter-term trend for the CRB, which was a decisive breakdown. But now the CRB has sharply reversed course and this longer-term chart shows that it is ready to challenge new highs.

There are so many more charts, but I am out of time.
Outlook Summary
- The short-term trend is up for stock prices as of Aug. 20.
- The economy is in expansion as of Sept. 19.
- The medium-term trend is up for treasury bond prices as of June 11 (prices higher, rates lower).
Disclaimer: I am not a registered investment adviser. My comments reflect my view of the market, and what I am doing with my accounts. The analysis is not a recommendation to buy, sell, ...
more

