
Walmart Inc. (WMT) – Elliott Wave Analysis (Daily Chart)
WMT Elliott Wave Technical Analysis
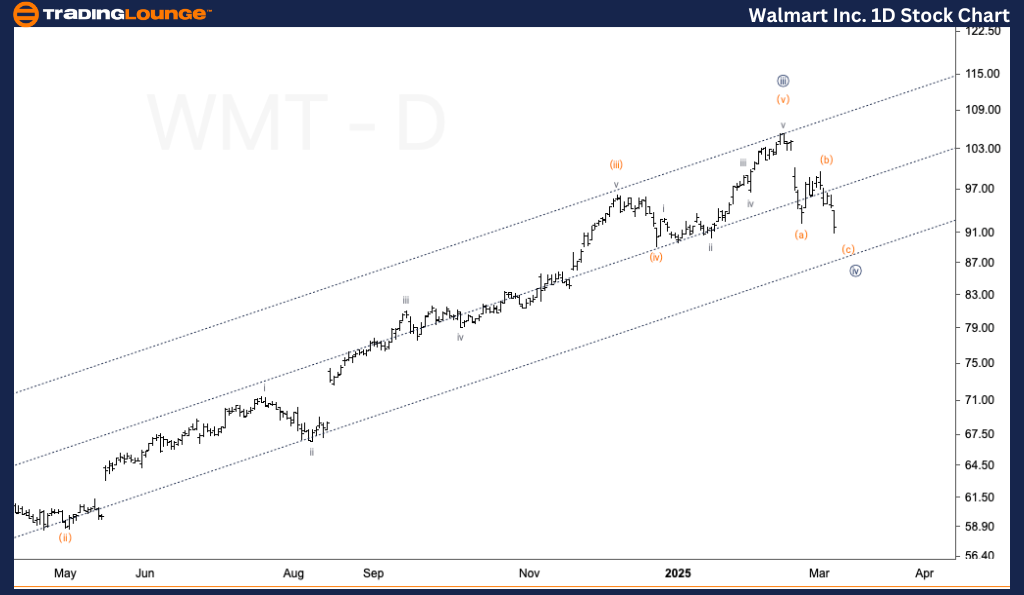
- Function: Counter-Trend
- Mode: Corrective
- Structure: ZigZag
- Position: Minute Wave {iv}
- Direction: Bottom in wave {iv}
Details:
Walmart (WMT) is in the final stages of a corrective Minute Wave {iv}, forming a ZigZag pattern. The stock is approaching a potential bottom near $88, where a bounce off the lower boundary of a temporary parallel channel is expected. This could mark the end of wave {iv}, signaling a potential reversal and continuation of the larger trend.
Walmart Inc. (WMT) – Elliott Wave Analysis (1H Chart)
WMT Elliott Wave Technical Analysis
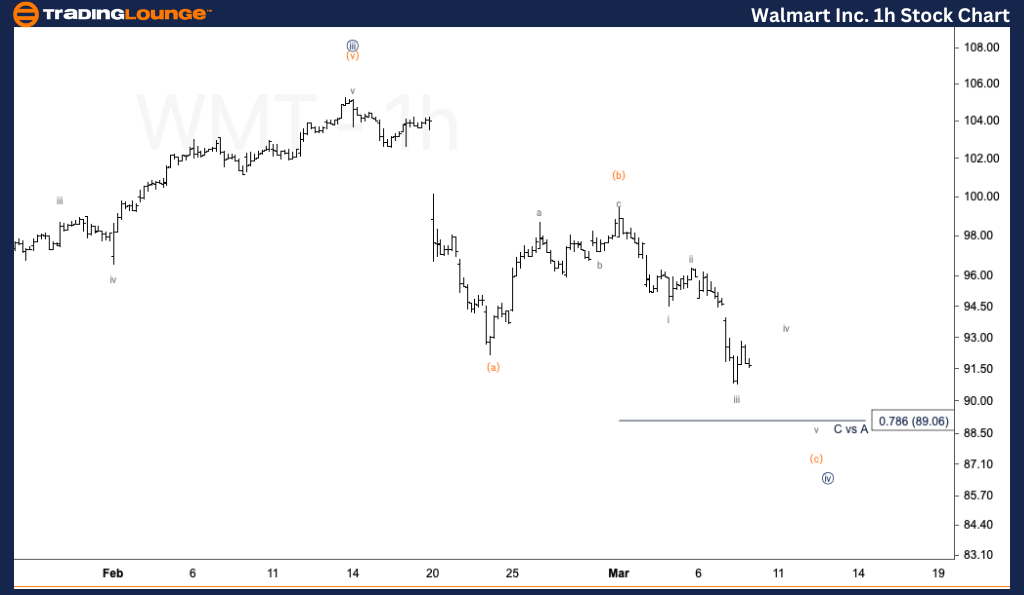
- Function: Counter-Trend
- Mode: Corrective
- Structure: ZigZag
- Position: Minute Wave {iv}
- Direction: Bottom in wave {iv}
Details:
On the 1-hour chart, WMT's corrective wave (c) of Minute Wave {iv} suggests that further downside is likely before the bottom is reached. The subdivision within wave (c) indicates that more downside is necessary to complete the correction, aligning with the expected bottom around $88, before a potential reversal into wave {v}.
This Elliott Wave Analysis evaluates both daily and 1-hour charts to assess WMT’s market trend and anticipate future price movements based on Elliott Wave Theory.
Technical Analyst : Alessio Barretta
More By This Author:
Elliott Wave Technical Forecast - Insurance Australia Group Limited
Elliott Wave Technical Analysis: British Pound/U.S. Dollar - Monday, March 10
Elliott Wave Technical Analysis: Dogecoin Crypto Price Today


Comments
Log in or sign up to join the conversation.