

MSTR Elliott Wave Analysis Trading Lounge
MicroStrategy Inc., (MSTR) Daily Chart
MSTR Elliott Wave Technical Analysis
FUNCTION: Trend
MODE: Impulsive
STRUCTURE: Motive
POSITION: Wave {v} of 3.
DIRECTION: Pullback in (iv) of {v}.
DETAILS: Looking for completion in wave (iv) to then continue higher and complete the five wave move into Minute wave {v} and back towards 500$.
.png.130253b6ee04d85171236cf5e2097c17.png)
MicroStrategy Inc., (MSTR) 1H Chart
MSTR Elliott Wave Technical Analysis
FUNCTION: Trend
MODE: Impulsive
STRUCTURE: Motive
POSITION: Wave (iv) of {v}.
DIRECTION: Downside in wave c of (iv).
DETAILS: Looking for completion in wave b which could turn out to be a triangle or else just a sideways correction, to then expect another leg lower in wave c towards 0.618 or equality of c vs. a at around 300$.
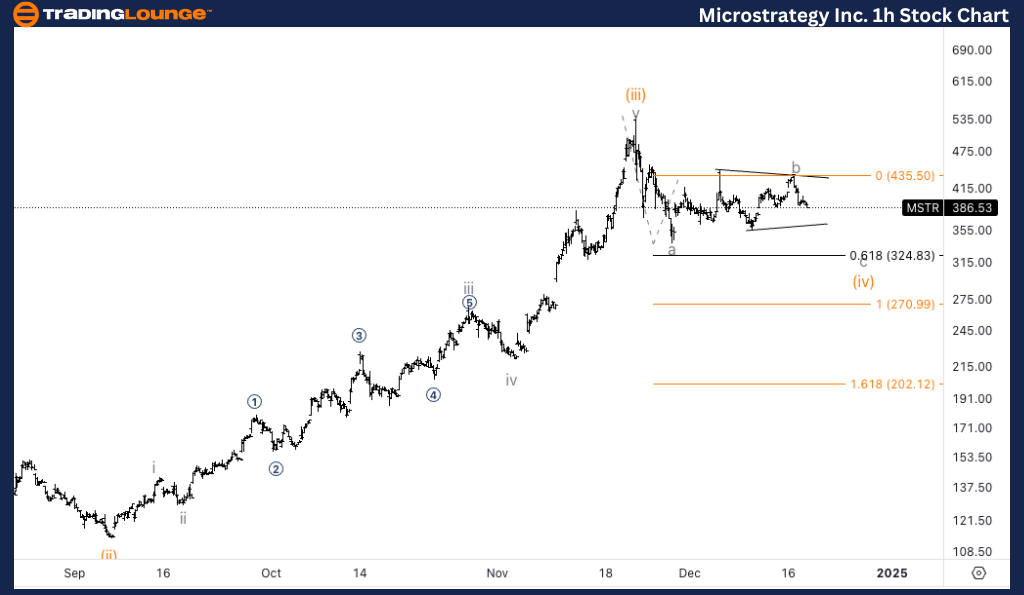
This analysis focuses on the current trend structure of MicroStrategy Inc., (MSTR) utilizing the Elliott Wave Theory on both the daily and 1-hour charts. Below is a breakdown of the stock's position and potential future movements.
* MSTR Elliott Wave Technical Analysis – Daily Chart*
The daily chart suggests that wave (iv) of {v} is in progress. A corrective pullback is expected to complete wave (iv), after which the stock should resume its upward trajectory to complete Minute wave {v}, potentially targeting levels around $500. Once wave (iv) concludes, the final leg of the five-wave impulsive sequence will likely unfold.
* MSTR Elliott Wave Technical Analysis – 1H Chart*
The 1-hour chart indicates that wave (iv) is still in progress, with wave b nearing completion. This could potentially form a triangle or a sideways correction. Once wave b completes, the expectation is for another leg lower in wave c, targeting around the 0.618 Fibonacci retracement or equality of wave c vs. wave a near $300. This final leg down would complete the corrective phase before the next upward move in wave {v} begins.
Technical Analyst : Alessio Barretta
More By This Author:
Unlocking ASX Trading Success - Insurance Australia Group Limited
Elliott Wave Technical Analysis: Euro/U.S. Dollar - Wednesday, Dec. 18
Elliott Wave Technical Analysis: AAVE Crypto Price News For Wednesday, Dec 18



Comments
Log in or sign up to join the conversation.