
Lam Research Corp., Elliott Wave Technical Analysis

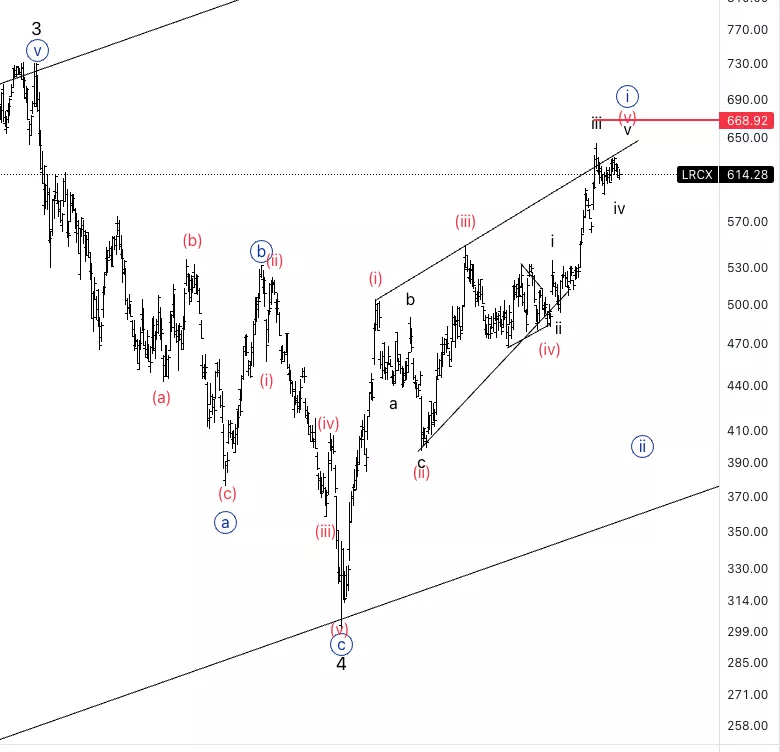
Lam Research Corp., (LRCX): Daily Chart, Wednesday, June 21.
LRCX Stock Market Analysis: The stock has been moving as expected for quite some time and we have been sitting at this level for a while. It looks like the trend is still bullish but being a leading diagonal wave (v) cannot to be longer than (iii) at 668$.
LRCX Elliott Wave Count: Wave (v) of {i}.
LRCX Technical Indicators: Above all averages.
LRCX Trading Strategy: Looking for one last leg higher to then retrace.
TradingLounge Analyst: Alessio Barretta
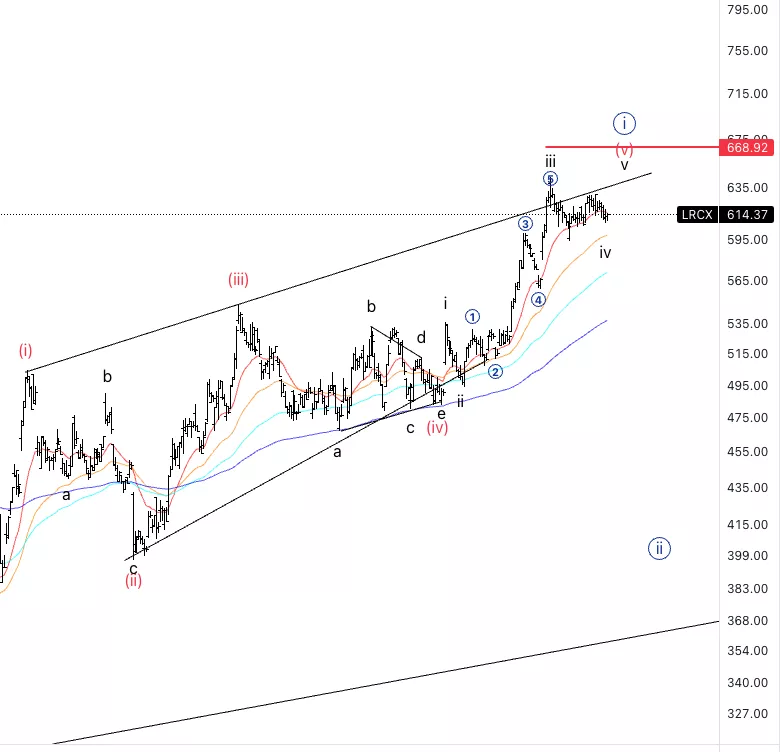
Lam Research Corp., LRCX: 4-hour Chart, Wednesday, June 21
Lam Research Corp., Elliott Wave Technical Analysis
LRCX Stock Market Analysis: Looking for one last move higher into wave v as the initial move down into wave iv looks like a three wave move, therefore bullish corrective.
LRCX Elliott Wave count: Wave v of (v).
LRCX Technical Indicators: Above all averages.
LRCX Trading Strategy: Looking for longs into wave v.
More By This Author:
Elliott Wave Technical Analysis: Ethereum, Wednesday, June 21
Elliott Wave Technical Analysis: NEO, Tuesday, June 20
Elliott Wave Technical Analysis: DexCom Inc, June 20


Comments
Log in or sign up to join the conversation.