

Image Source: Pixabay
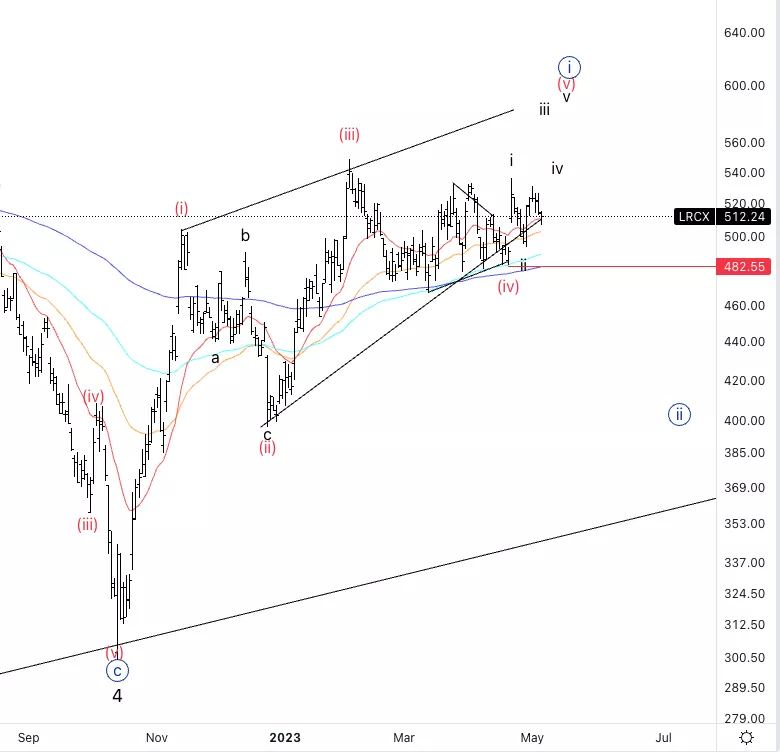
Lam Research Corp., Elliott Wave Technical Analysis
Lam Research Corp., (Nasdaq: LRCX): Daily Chart, 5 May 2023.
LRCX Stock Market Analysis: It looks like the triangle had been confirmed with the upmove in what seems to be wave i. Alternatively, we have a truncated wave (v) and we are resuming lower.
LRCX Elliott Wave Count: Wave i of (v).
LRCX Technical Indicators: Above all averages, 20EMA as support.
LRCX Trading Strategy: Looking for further upside into wave iii with invalidation level where the red line is at 482.5$.
Analyst: Alessio Barretta
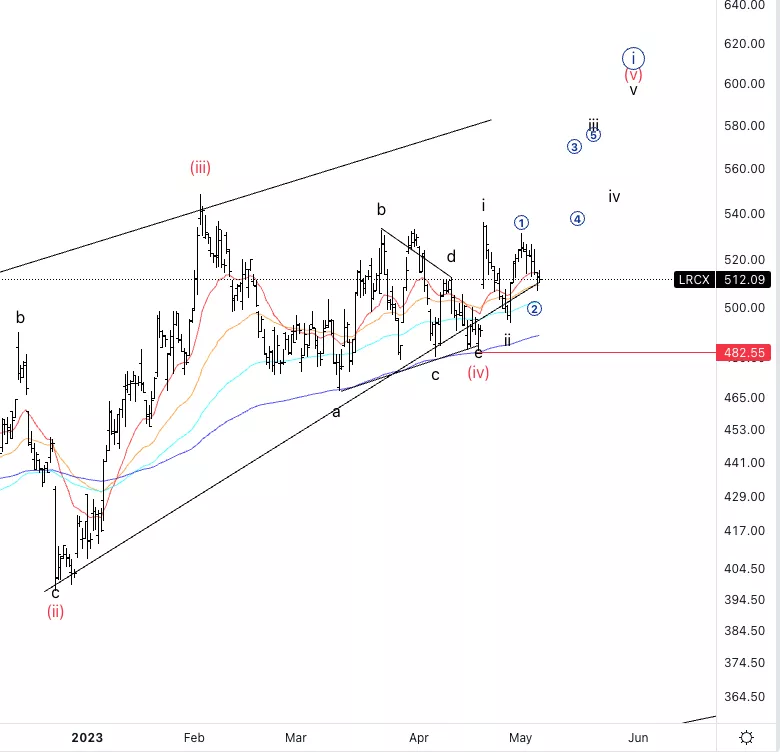
Lam Research Corp., LRCX: 4-hour Chart, 5 May 2023.
Lam Research Corp., Elliott Wave Technical Analysis
LRCX Stock Market Analysis: It looks like we are in wave 2 of iii which seems to be confirmed by looking at even lower timeframes as we seem to have a three wave move into micro wave 2.
LRCX Elliott Wave count: Wave 2 of iii.
LRCX Technical Indicators: 20EMA as support.
LRCX Trading Strategy: Looking for further upside into wave iii with invalidation level where the red line is at 482.5$.
More By This Author:
Elliott Wave Technical Analysis: United Parcel Service Inc. - Thursday, May 4
Elliott Wave Technical Analysis: Dogecoin, May 4
Elliott Wave Technical Analysis: Okta Inc. - Wednesday, May 3


Comments
Log in or sign up to join the conversation.