
JNJ Elliott Wave Analysis – TradingLounge Daily Chart
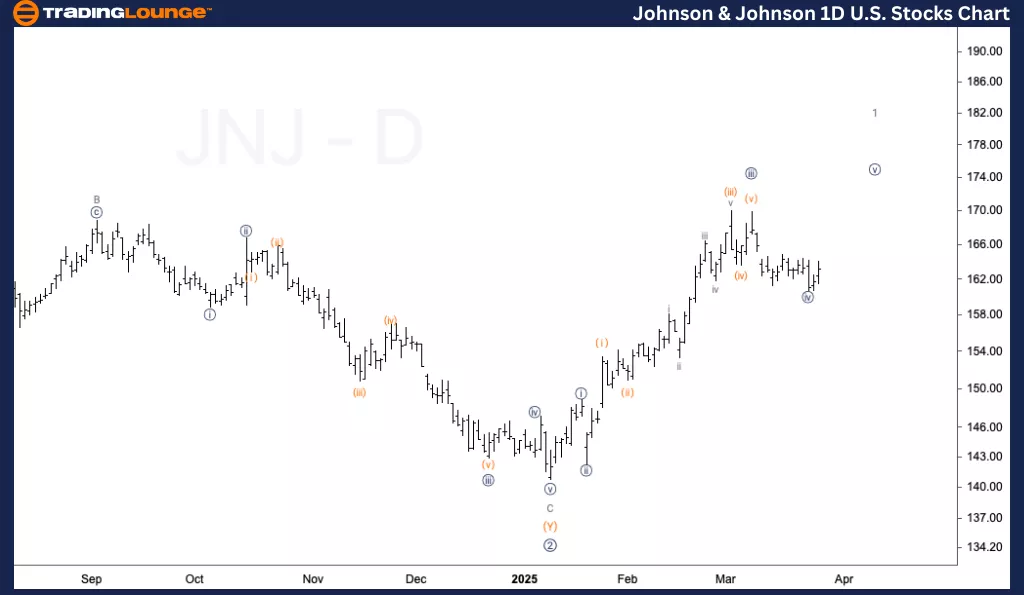
Johnson & Johnson (JNJ) – Daily Chart
- Function: Trend
- Mode: Impulsive
- Structure: Motive
- Position: Wave {v} of 1
- Direction: Upside within wave {v}
- Details: Looking for further upside into wave {v}, as we appear to be missing one leg higher to complete this five-wave move subdivision. Targeting around $180, the end of MG2 as the upside target.
JNJ Elliott Wave Analysis – TradingLounge 1-Hour Chart
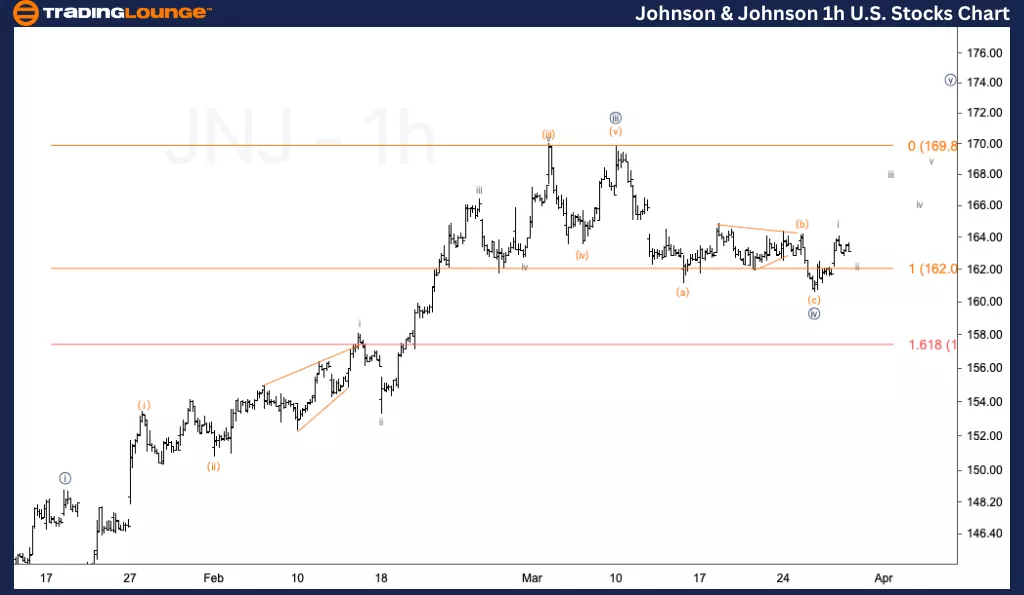
Johnson & Johnson (JNJ) – 1-Hour Chart
- Function: Trend
- Mode: Impulsive
- Structure: Motive
- Position: Wave i of (i)
- Direction: Upside in wave (i)
- Details: We are looking at the subdivision within wave {v}. The price has reached equality in length between waves {ii} and {iv}, which is often a key area of interest for wave {iv} targets. We are awaiting confirmation of further upside.
This analysis of Johnson & Johnson (JNJ) incorporates both the daily and 1-hour charts, utilizing Elliott Wave Theory to assess current market trends and forecast future price movements.
- Daily Chart: Looking for further upside in wave {v}, as the final leg higher seems to be missing. Targeting $180, which marks the end of MG2. The trend remains bullish until wave {v} is completed.
- 1-Hour Chart: Analyzing the subdivision within wave {v}, with equality in length between waves {ii} and {iv} suggesting wave {iv} is a potential target. Further upside confirmation is awaited.
Technical Analyst: Alessio Barretta
More By This Author:
Elliott Wave Technical Forecast: News Corporation - Friday, March 28
Elliott Wave Technical Analysis: Euro/U.S. Dollar - Friday, March 28
Elliott Wave Technical Analysis Theta Token Crypto Price News Today


Comments
Log in or sign up to join the conversation.