

Image Source: Pixabay
Intercontinental Exchange Inc., Elliott Wave Technical Analysis
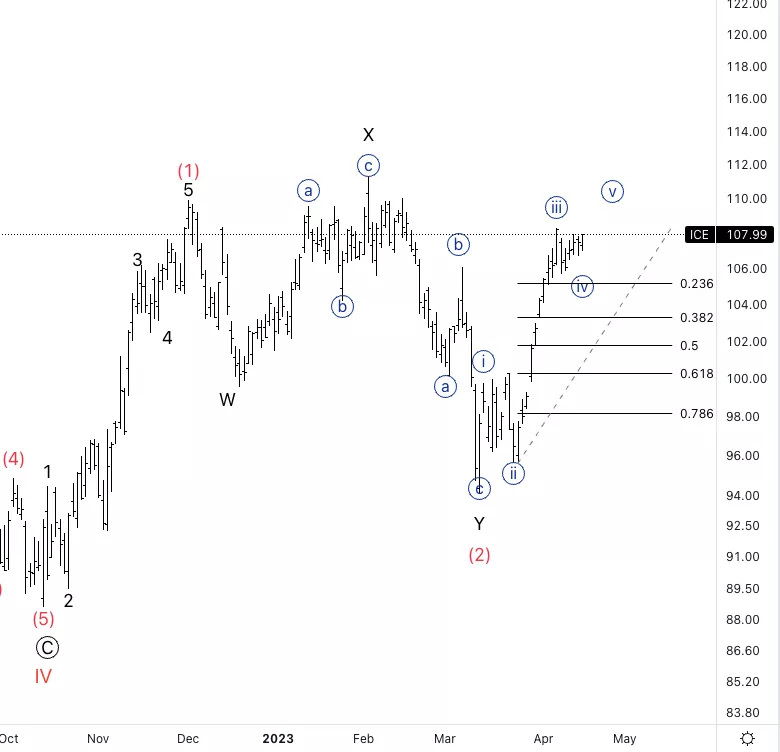
Intercontinental Exchange Inc., (NYSE: ICE): Daily Chart, 18 April 2023.
ICE Stock Market Analysis: At this point, it looks like we have complete wave {iv} and we are resuming higher into wave {v}.
ICE Elliott Wave Count: Wave {iv} of 1.
ICE Technical Indicators: Above all averages, cross between 20 and 200EMA.
ICE Trading Strategy: Looking for further upside into wave {v} to potentially reach near the area of wave X on the left.
Analyst: Alessio Barretta
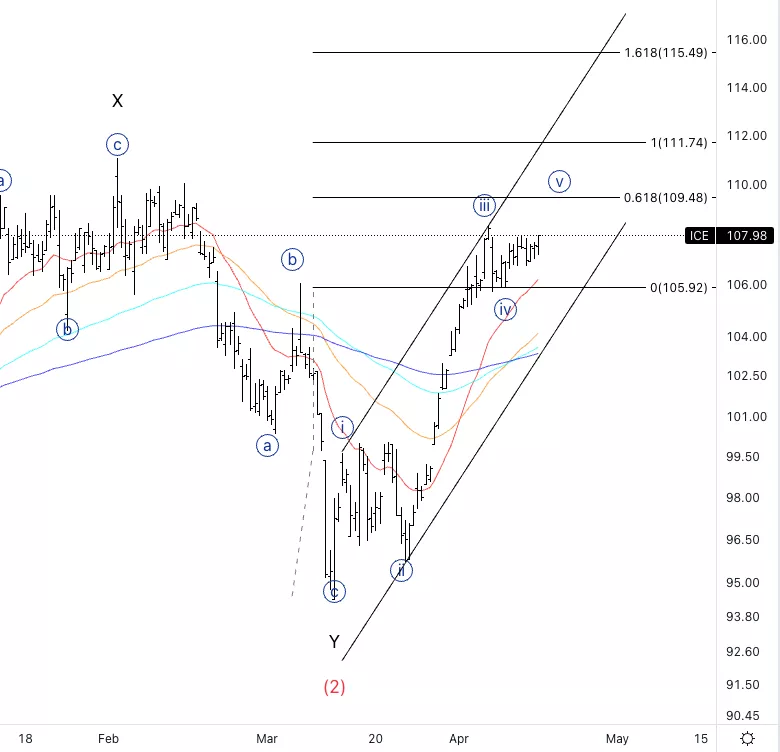
Intercontinental Exchange Inc., ICE: 4-hour Chart, 18 April 2023.
Intercontinental Exchange Inc., Elliott Wave Technical Analysis
ICE Stock Market Analysis: We are looking at the equality of {v} vs. {i} at 111$. The alternate is that we are in some sort of wave (b) of {iv{ and we’ll resume lower to complete the correction.
ICE Elliott Wave count: Wave {iv} of 1.
ICE Technical Indicators: Above all averages.
ICE Trading Strategy: Looking for further into wave {v} to reach around equality with {i}.ss as a target.
More By This Author:
Elliott Wave Trading Strategies: SP500, Nasdaq, Russell 2000, DJIA
Elliott Wave Technical Analysis: Lam Research Corp., April 17
Elliott Wave Technical Analysis Ethereum/ U.S. Dollar - Monday, April 23


Comments
Log in or sign up to join the conversation.