
Fortinet Inc., Elliott Wave Technical Analysis

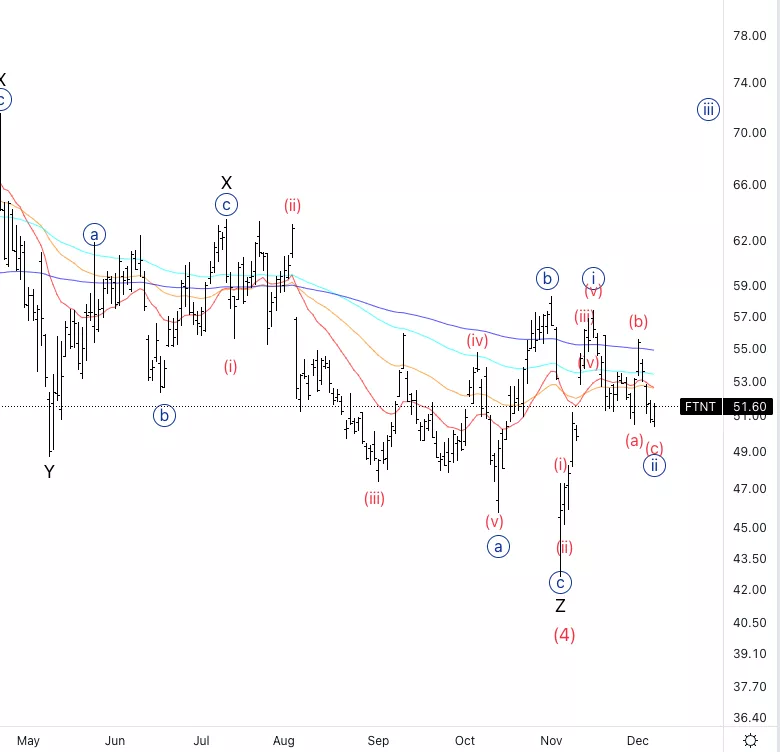
Fortinet Inc., (FTNT): Daily Chart, December 8, 2022
FTNT Stock Market Analysis: We had a double correction compared to the previous forecast and what is most important is that the move down in potential wave {ii} remains a three wave move for the time being.
FTNT Elliott Wave Count: Wave {ii} of 3.
FTNT Technical Indicators: Below all EMAs with averages starting to cross.
FTNT Trading Strategy: As the averages are starting to cross it could signify a bullish reversal is imminent, however we need further confirmation before calling this the low.
TradingLounge Analyst: Alessio Barretta
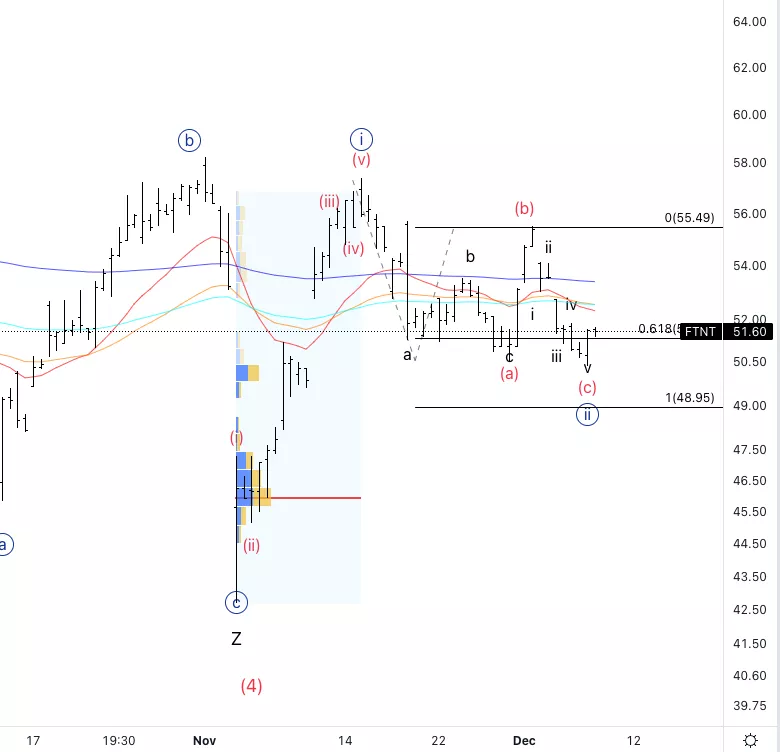
Fortinet Inc., FTNT: 4-hour Chart, December 8, 2022
Fortinet Inc., Elliott Wave Technical Analysis
FTNT Stock Market Analysis: We can count three waves down into wave (a) and already five small waves into wave (c) which suggest the correction could be completed, as well as we reached 0.618 (c) vs. (a).
FTNT Elliott Wave count: Wave (c) of {ii}.
FTNT Technical Indicators: Below all EMAs with averages starting to cross.
FTNT Trading Strategy: Looking for longs into wave {iii} not before we at least break wave (b).
More By This Author:
Elliott Wave Technical Analysis: AAVE / U.S. Dollar, Thursday, Dec. 8
Elliott Wave Technical Analysis: Honeywell, Inc., Wednesday, Dec. 7
Elliott Wave Technical Analysis: Bitcoin/US Dollar, Wednesday, Dec. 7


Comments
Log in or sign up to join the conversation.