

Photo by Joshua Mayo on Unsplash
DexCom Inc., Elliott Wave Technical Analysis
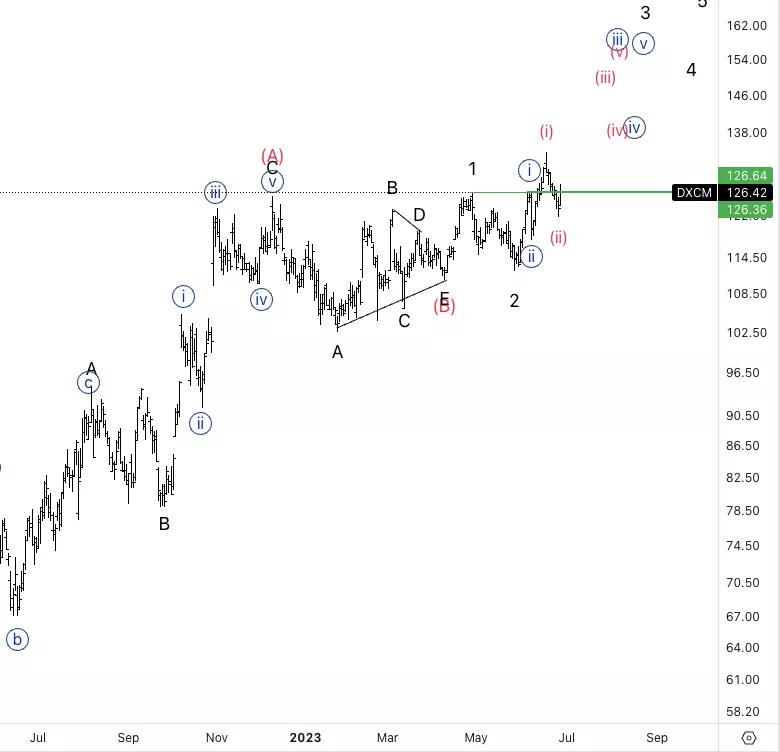
DexCom Inc.,(Nasdaq: DXCM): Daily Chart, 29 June 2023.
DXCM Stock Market Analysis: We have been looking at upside resumption into wave (C) as we seem to be continuing higher into a series of ones and twos.
DXCM Elliott Wave Count: Wave 3 of (C)
DXCM Technical Indicators: 20EMA as support.
DXCM Trading Strategy: Looking for upside into wave {iii} as long as we don’t break the bottom of wave {ii}.
Analyst: Alessio Barretta
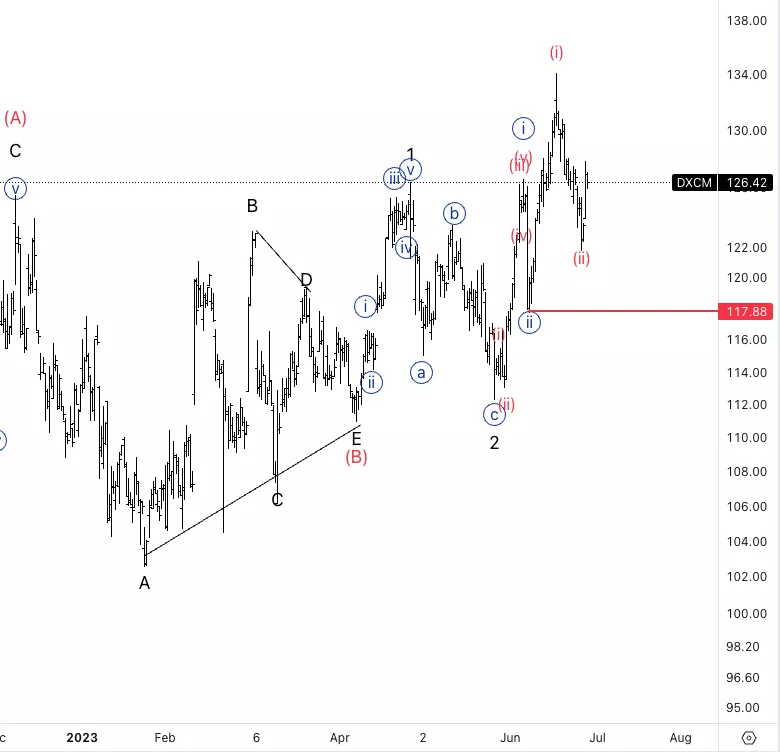
DexCom Inc., DXCM: 4-hour Chart, 29 June 2023
DexCom Inc., Elliott Wave Technical Analysis
DXCM Stock Market Analysis: Looking for upside into wave (iii) to be already on the rise, as further downside could most likely invalidate the count. If we are within a third of a third I’d expect strong upside.
DXCM Elliott Wave count: Wave (iii) of {iii}.
DXCM Technical Indicators: 20EMA as support.
DXCM Trading Strategy: Looking for upside into wave (iii) with invalidation at 117$.
More By This Author:
Bitcoin Elliott Wave Analysis - Wave (c) Of Ii)
Elliott Wave Technical Analysis: Monster Beverage Corp. - Wednesday, June 28
Elliott Wave Technical Analysis: NEO/U.S. Dollar - Wednesday, June 28


Comments
Log in or sign up to join the conversation.