
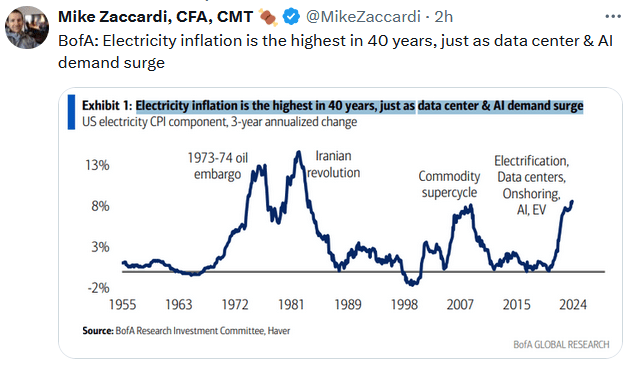
The graph below shows that the price of electricity is surging. It has risen by about 8% annually over the last three years. Going back to 1955, there have only been three other price increases of a similar magnitude. The electricity inflation in 1973 and the early 1980s was related to the surging oil price due to our relationship with Iran. The one that peaked in 2008 occurred when the price of crude oil briefly touched $150 a barrel, and natural gas was over $14.
The current inflationary cycle is unique, driven by electricity demand rather than surging input prices. In fact, the price of natural gas is near a 30-year low of $2.40. Natural gas is the predominant energy source used in electricity generation. Some of the increases are surely related to the broader inflation impacting the economy. However, as the graph denotes, some are due to incremental demand from AI data centers and EVs.
What To Watch Today
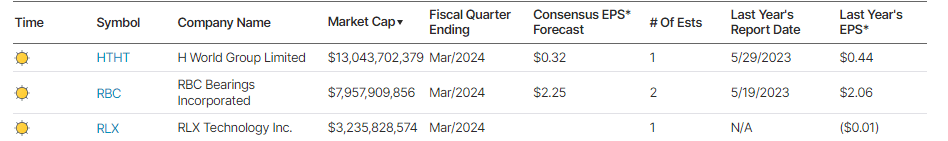
Earnings
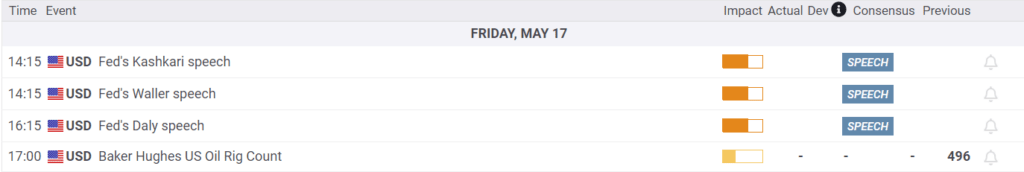
Economy
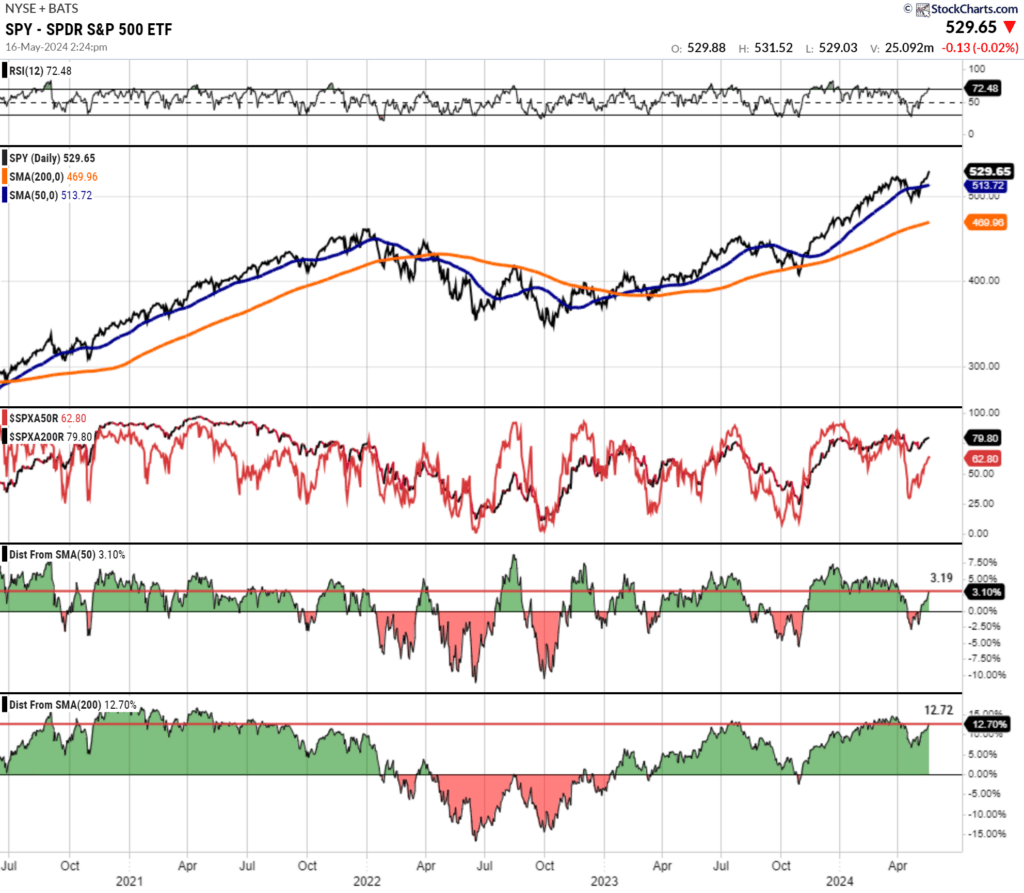
Market Trading Update
As discussed yesterday, the market is overbought after surging to all-time highs on Wednesday. As we stated then:
“While there is no reason to be bearish, continue rebalancing as needed to maintain risk profile tolerances in your portfolio. A pullback to retest the 50-DMA is likely within the next few days to weeks, providing a better opportunity to increase exposures as needed heading into the summer months.”
From current levels, it will be unsurprising to see the markets struggle to make further highs without a short-term pullback to the 50-DMA to reset buying conditions. The current deviation from the 50- and 200-DMA continues to move higher. While such deviations do not mean a correction is imminent, they are good indicators for becoming a bit more cautious about risk-taking, particularly when markets are overbought, as they are now. While the number of stocks trading above their respective 50-DMA is improving, it remains rather weak, considering the current exuberance in the market.
As noted yesterday, all of this remains bullish but suggests that risk management remains key.
The Big Problem for Small-Cap Performance
On Monday, we shared commentary highlighting how small-cap corporate profit margins have fallen rapidly over the last few years while large-cap margins are near record highs. Larger-cap companies are much more efficient regarding borrowing costs and passing inflation onto their customers. Those and other factors help account for some of the irregular margin divergence.
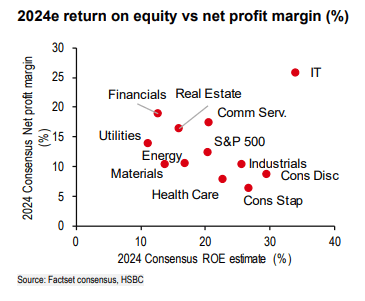
Another critical factor is the composition of the small and large-cap indices. As shown below, IT has much larger margins and Returns on Equity than every other sector.
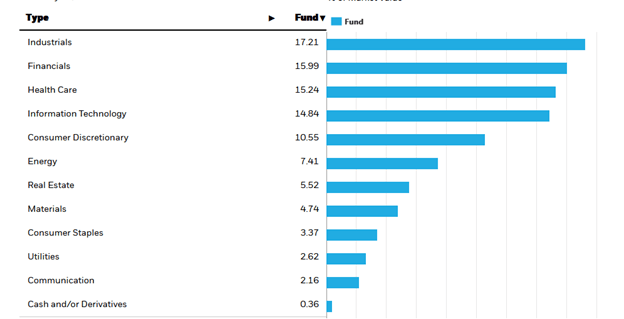
The first heat map below shows that IT constitutes nearly 30% of the large-cap S&P 500. The second heat map below shows that IT only constitutes about 15% of IWM, the small-cap index. Given the relatively significant margin expansion in IT over the last few years, the composition of the large and small-cap indexes helps further explain the divergence discussed in the aforementioned commentary.

Housing Starts Show Signs of Weakness in April
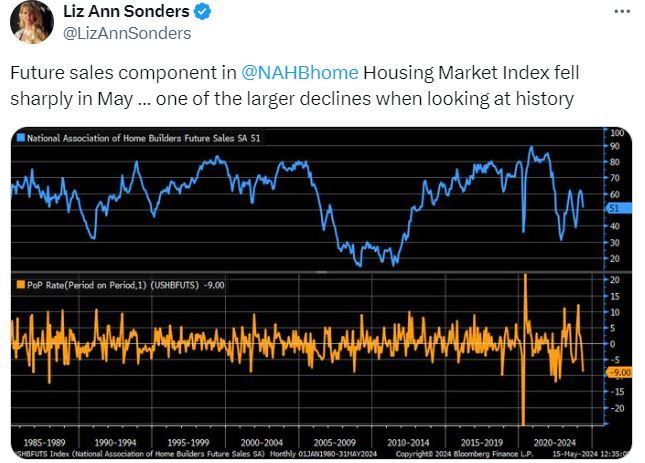
April Housing Starts of 1.36 million came below consensus expectations of 1.42 million. On an annualized basis, they rose 5.7% MoM versus expectations of a 7.6% increase. Due to the sharp decline in March, the two-month rolling change is down roughly 9%. Furthermore, Housing Starts have fallen over 25% from their peak level two years ago. Building permits also came in sluggish, falling 3% MoM compared to expectations for a 0.1% increase.
What’s more telling is that housing starts usually outpace completions in a strong economy. However, as shown in the chart below from Zero Hedge, the past few months have seen housing starts substantially lagging completions. This could have a material impact on construction employment, given that Housing Starts are an important leading indicator for the economy.

Tweet of the Day
More By This Author:
Is Buffett’s Cash Hoard A Market Warning?Retail Sales And CPI Return Hope For A September Cut
The GME And AMC Short Squeeze Is On Again


Comments
Log in or sign up to join the conversation.