
Earnings Growth Beginning To Trend Towards More Normal Level
Our positive view on the market coming out of the pandemic contraction has partially centered on earnings growth expectations. A number of factors played a part in this point of view, i.e., growth in pent-up demand, easier year-over-year data comparisons, and more. As the economic environment nears a more normal rate of growth, other variables begin to normalize as well with a critical one being earnings. And with corporate earnings, analysts' growth expectations are beginning to decline. As the second-quarter earnings reports are nearing an end, the below table shows YoY quarterly earnings growth peaking at 94.7% for Q2 for companies in the S&P 500 Index. As the quarters roll into 2022, the YoY comparisons becoming more difficult, in part due to elevated corporate earnings now due to higher demand, i.e., satisfying pent-up demand. Importantly, as the back half of 2022 earnings growth expectations show, double-digit earnings growth is expected to resume. For the calendar years, 2021, 2022, and 2023 earnings are expected to equal, $201, $220, and $236, respectively.
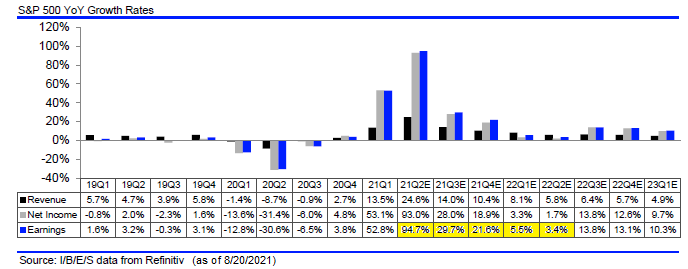
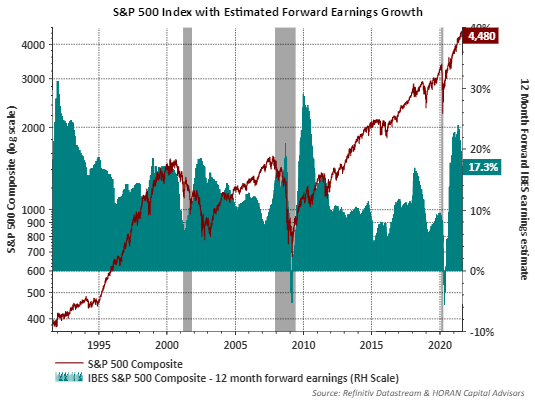
One factor that can create a headwind for a particular stock and/or Index is the growth rate of earnings slowing. However, coming out of a recession like just experienced, a spike in earnings growth, then a slowing to a more reasonable rate of growth, is a mostly normal pattern as seen below. During this period of slowing, and as the economy continues to grow, historically, the equity market has continued to trend higher, all else being equal.
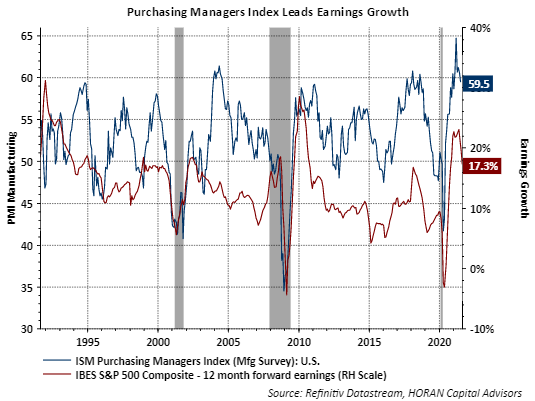
The slowing of the earnings growth rate can be anticipated by tracking some economic variables. One, in particular, the Purchasing Mangers' Index (PMI) for Manufacturing tends to decline a month or so before earnings slow. The below chart shows the ISM PMI for Manufacturing and it has clearly trended downward from its March peak. A PMI above 50 though means manufacturing is expanding and that is the case now. Other economic variables can serve as leading indicators as well, in fact, components of the ISM PMI are incorporated in the Conference Board's Leading Economic Index.
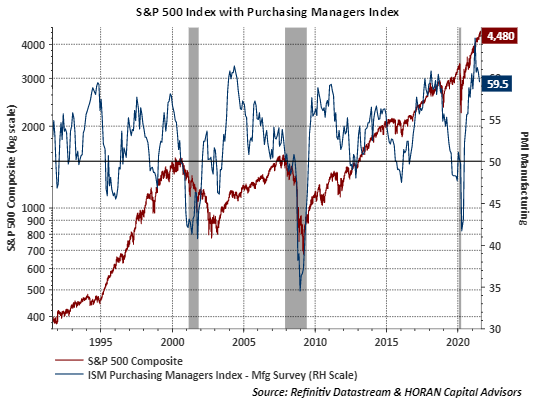
Although the ISM PMI is declining, this alone does not necessarily mean stocks are headed for a decline. The below chart shows an environment where manufacturing is expanding (a PMI above 50) and the equity market tends to generate positive returns.
Understanding the weak components that are leading to a weaker PMI is useful though. In ISM's most recent report for July, Timothy R. Fiore, CPSM, C.P.M., Chair of the Institute for Supply Management® (ISM®) Manufacturing Business Survey Committee, noted,
“Business Survey Committee panelists reported that their companies and suppliers continue to struggle to meet increasing demand levels. As we enter the third quarter, all segments of the manufacturing economy are impacted by near record-long raw-material lead times, continued shortages of critical basic materials, rising commodities prices, and difficulties in transporting products. Worker absenteeism, short-term shutdowns due to parts shortages and difficulties in filling open positions continue to be issues limiting manufacturing growth potential. Optimistic panel sentiment remained strong, with thirteen positive comments for every cautious comment."
Clearly, it seems some of the weaker components of the manufacturing PMI are related to positive business activity. The shortages with raw material supplies, transportation difficulties, and labor shortages are all a symptom of the pandemic shutdown and now rapid reopening.
Lastly, I wrote recently about the potential for the equity market to continue its advance higher over the next few years. If the future earnings picture unfolds as currently expected, this positive market environment could be realized, with the caveat, not in a straight line. From time to time I highlight various sentiment measures as they provide a contrarian perspective on the market. In a recent sector report by Fidelity, they provided information on the market's expectation of tail risk fears by evaluating the CBOE Skew Index and what the skew level indicated for future stock returns. Fidelity's lead for the below graphic noted,
"Skew, a statistic derived from the options market measures investors’ perception of tail risk, or the risk of extreme market events. It’s very high currently, in the top decile of its historical range—and that may be a good sign for the stock market. Like many sentiment indicators, skew has often been useful as a contrarian signal, historically: In the past, the more concerned investors have been about tail risk, the shallower drawdowns have been."
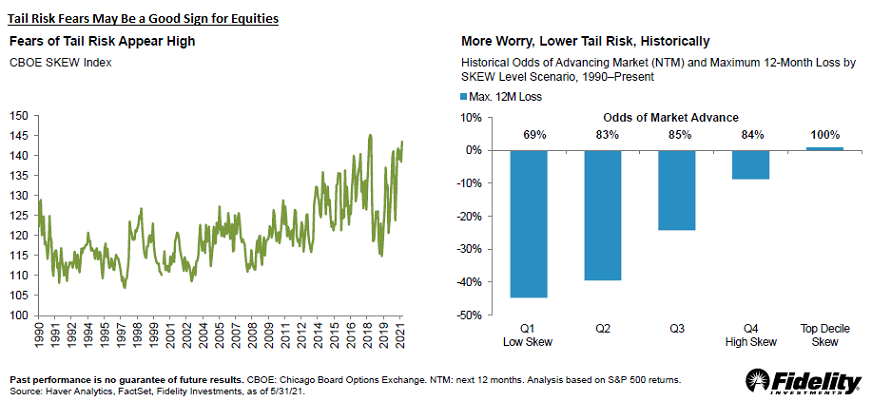
As the right chart notes, high levels of fear tend to be associated with favorable market returns over the next twelve months. With the current skew in the top decile, the chart indicates advance odds are 100%. This might be one time it is reasonable to say it might be different this time. Also, the analysis period for the above data only goes back to 1990, but this current market does seem to be climbing one big wall of worry.
Disclaimer: The information and content should not be construed as a recommendation to invest or trade in any type of security. Neither the information nor any opinion expressed constitutes a ...
more

