
During Uncertain Times, Follow The Money
The market has made an incredible, if not unbelievable, recovery from its late March lows — despite being in the midst of a global pandemic, record unemployment, social unrest, and much uncertainty surrounding the November election. Meanwhile, just this morning we learned the U.S. economy contracted at a record 32.9% annual rate last quarter and weekly jobless claims rose to 1.43 million amid signs of a slowing recovery.
This is precisely why Asbury Research is completely data-driven. While most of the financial community is wringing its hands and trying to make sense of all of this, we are just following the money — via our quantitative models and objective, repeatable methodology.
Table 1 below is a good example of this. It shows that our Asbury 6, one of two in-house Tactical models we use to stay on the right side of the market, is currently Positive and has been since July 2nd. The “A6” is updated in our Research Center every morning before the market open, based on closing data from the previous day.
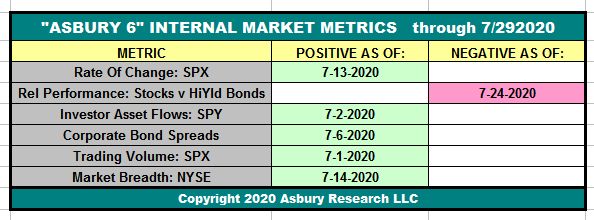
Table 1
The dates in each cell indicate when each individual constituent of the A6 turned either positive (green) or negative (red). When all Asbury 6 are positive, market internals are the most conducive to adding risk to portfolios. Each negative reading adds an additional element of risk to participating in current or new investment ideas.
Our other Tactical model, the Correction Protection Model (CPM), has been on a Risk On status (adding risk to portfolios) since July 6th. Chart 1 below highlights CPM’s Risk On and Risk Off signals since 2019.

Chart 1
So, despite all the turmoil and adverse market conditions, the day-to-day internal condition of the market — as indicated by our models — has been mostly positive since late March. And we just follow the money.
In our previous July 16th Stock Market Update & Asbury Investment Management Video, we pointed out that the benchmark S&P 500 (SPX) had risen from a June test of major underlying support and was testing primary overhead resistance at 3215 to 3233. Chart 2 below, an updated version of the one from that July 17th update, shows that SPX continues to test 3215 to 3233 resistance and is apparently having some trouble getting through it.
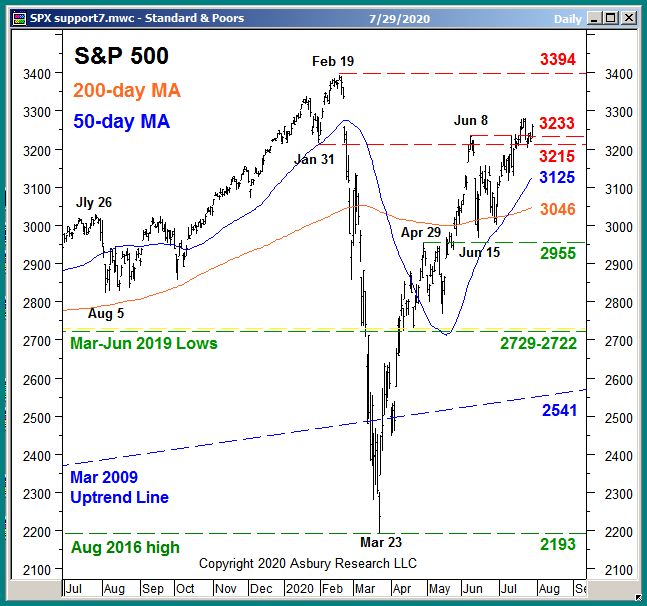
Chart 2
A sustained rise above SPX 3215-3233 is necessary to clear the way for a potential retest of the 3394 all-time high that was set back ion February. As long as our Tactical models remain Risk On / Positive, we will expect that this resistance level will eventually be broken. If the models turn, however, as they did in late February, we will be reducing our exposure and protecting our capital.
Disclosure: None.


