
Duke Energy Struggles To Break Higher; Tough Times Ahead For McDonalds
(Click on image to enlarge)
Time to check in on a couple of my bellwether stocks and the first of these is Duke Energy with the ticker DUK and one I have had on my watchlist for trading covered calls over the years. And the daily chart for this stock has been building such a phase over the last few weeks and one which highlights the importance of support and resistance and a key plank of the volume price analysis methodology.
In this case, it is a resistance which is the focus building in the $90 per share area. The two dashed lines, one red and one blue are generated by the accumulation and distribution indicator which automatically displays the strength of each level via the thickness of the line. Every time such a level is tested and holds, the line thickens accordingly, and in this case not only do we have one extremely strong level in red, but a second in blue. Together, these present a solid wall of resistance and one which is now weighing ever more heavily on the stock. Above we also have the volume point of control denoted with the yellow dashed line, and where a further phase of congestion is likely to follow. However, what is interesting to note is the attempt to breach the $90 per share level earlier in the month on high volume, which failed, and given each attempt to rally is on falling volume and narrow spreads, the stock looks weak.
The next earnings date is May 12 with a forecast of $1.21 EPS against 1.24 EPS last time for the same period with any shortfall likely to see the stock fall.
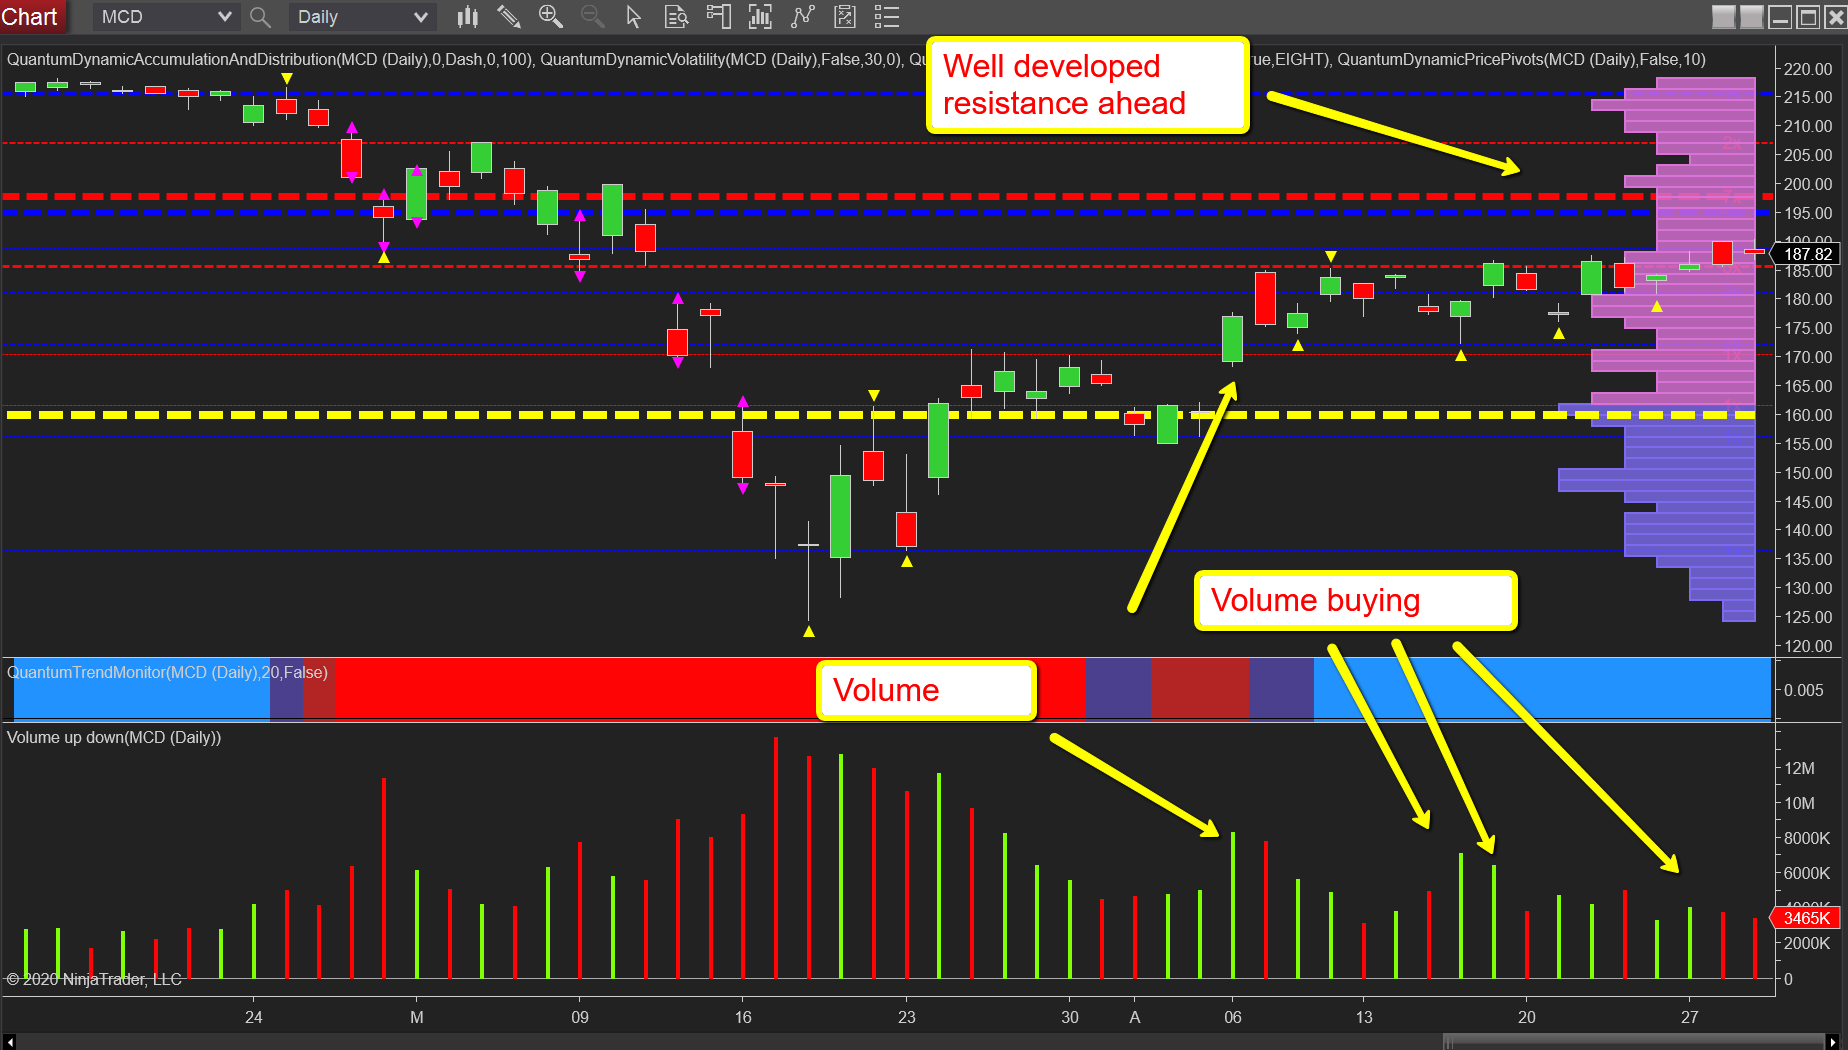
(Click on image to enlarge)
And the second is MCD and one I highlighted several weeks ago following the stopping volume and strong buying we saw on the two big hammer candles of mid-March. Since then the road higher has been punctuated with minor reversals, but each time a fresh injection of volume has driven the stock higher.
Now, much like Duke Energy, deep and solid resistance is now the key technical issue for this stock with a red and blue level at $195 – $197 on the accumulation and distribution indicator. Earnings are due pre-market with a forecast of $1.59 against $1.72 last year, but with CV19 weighing, a tough call on whether results will be perceived as less bad than expected and hence rally! Nevertheless, the technical resistance will play a key part over the next few days.
Disclaimer: Futures, stocks, and spot currency trading have large potential rewards, but also large potential risk. You must be aware of the risks and be willing to accept them in order to invest in ...
more

