
Dow, Nasdaq Price Forecast: US Stocks September Slide Continues
US STOCKS RUN INTO SELLERS AT SEPTEMBER OPEN
After a blistering rally took US markets by hold in late-March, the Nasdaq gained as much as 88% over the next five months-and-change. The Dow Jones Industrial Average was up by a more modest 60% but given that this was taking place as a global pandemic was taking the world by storm, it was still a very respectable number in a relatively short period of time. To be sure, there was some rationale for this move to develop; perhaps not to the degree that it did, but when you have all of the Federal Reserve, the Treasury Department and Congress aiming the stimulus cannons at a problem, there’s likely to be some element of response. Given the fact that bond yields were incredibly low and the investing world had a dearth of alternative investment options, this rally might make a little more sense. But – it does beg the question of value and whether or not current levels are warranted given the number of questions in the backdrop.
Those equity rallies in the US were incredibly consistent through the bulk of the summer, driving all the way through August as the Federal Reserve shifted their strategy to be perhaps even more accommodative in the future. But it was just days after Jerome Powell unveiled this shift at the Jackson Hole Economic Symposium that equities pushed up to that fresh high, and then began to reverse.
The Nasdaq is likely going to be the most operative focal point: The tech-heavy index gained a whopping 88% from the March lows up to that September first high, setting a fresh all-time-high in June and continued to chug along through July and August. Correspondingly, as sellers have shown up in September, the index has also pulled back with aggression, giving up approximately -14% from those prior highs set just a few weeks ago.
NASDAQ 100 FOUR-HOUR PRICE CHART
(Click on image to enlarge)
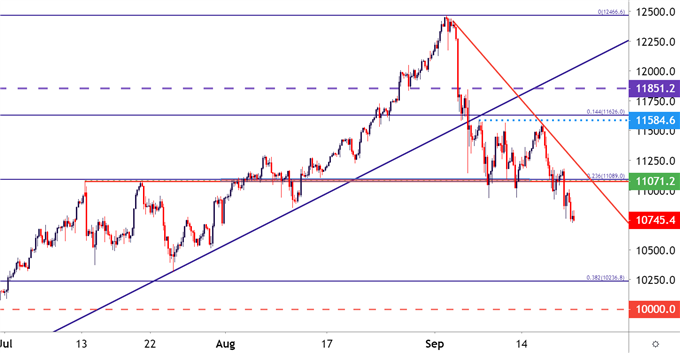
Chart prepared by James Stanley; Nasdaq 100 on Tradingview
NASDAQ 100 SLIPS BELOW SUPPORT
Last week saw the index open the week with a key area of support in-play. This came from around the 23.6% Fibonacci retracement of that recent major move. But after a mild bounce on Monday and Tuesday, sellers came back on Wednesday and drove through the end of the week; with that selling pressure continuing to show in US equity futures to kick off this week.
At this point, given the dearth of historical samples of the index trading above 10k, there’s a lack of nearby supports. A bit-deeper, around 10,236 is the 38.2% retracement of the March-September move, but if prices push down to this level we’ll be looking at an approximate -18% pullback from the September 1st high. A bit lower, around the 10k psychological level, would be another area of potential support and this would be approximately -19.89% from the 9/1 highs and getting very close to that ‘bear market territory’ area on the Nasdaq 100.
NASDAQ 100 DAILY PRICE CHART
(Click on image to enlarge)
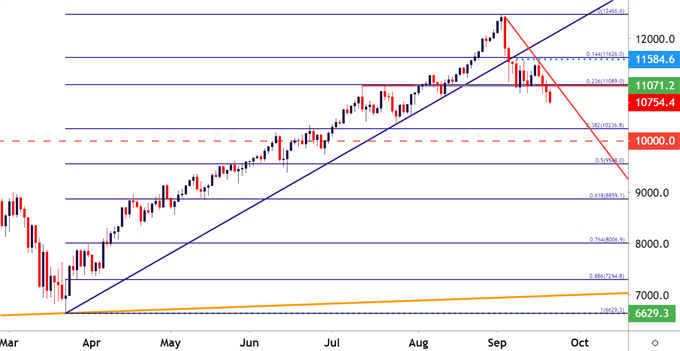
Chart prepared by James Stanley; Nasdaq 100 on Tradingview
THE DOW: SLOWER TO RISE, SLOWER TO FALL (SO FAR)
As the tech-heavy Nasdaq put in a blistering trend since the March lows, the Dow Jones Industrial Average has been a slower mover. To be sure, a 60% rally is nothing to sneeze at, especially as the world slugs through a pandemic with still-unknown consequences. But, in case of comparison that trend was slower than the 88% in the Nasdaq and the 66% in the broad-based S&P 500. And another key factor – the Dow did not make a fresh all-time-high while both the Nasdaq and S&P 500 did; and the Dow continued to show a bit of restraint below that prior high that was set in February, just before the pandemic began to get priced-in.
But, once luxury of that restraint has been a more mild pullback than what’s been seen in the tech-heavy Nasdaq; and the September sell-off in the Dow, at least so far, has more of a pullback-type of appearance than what’s shown in the Nasdaq so far.
The Dow is down by as much as -7.3% from that September 1st high, and prices are testing a big zone of confluent support on the chart. The area that runs from 27159-27528 had come into play to mark resistance in June with another inflection in mid-July. When prices did finally budge above this key area on the chart, it was quickly repurposed as support in late-August and then again in early-September.
Also in the support column was a bullish trendline projection that could be found by connecting late-June and late-July lows; the projection of which had helped to hold support into last week’s close.
DOW JONES DAILY PRICE CHART
(Click on image to enlarge)
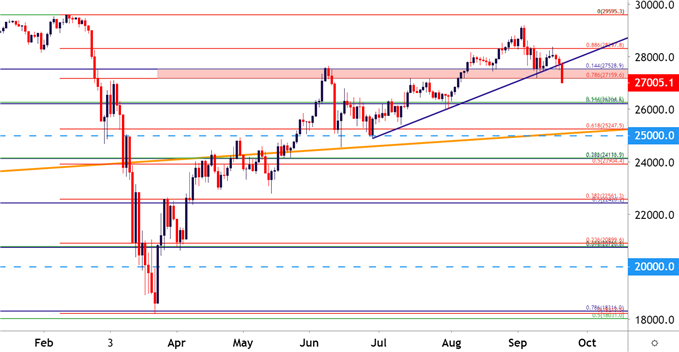
Chart prepared by James Stanley; Dow Jones on Tradingview
The big question at this point is whether buyers will be able to continue defending this area, or whether sellers will have their way here, as well. Dow futures started the week by pushing down to the bottom of this area, continuing a recent trend of lower-lows and lower-highs and breaking below the bullish trendline along the way.
For deeper support potential, there is another zone of interest just below current price action, plotted around 26,208-26,264; the bottom of which is approximately -10.2% from those prior highs. This could be an area of interest to evaluate for bigger-picture trend capacity, as a bounce up to another lower-high could quickly re-open the door for reversal potential in the index; and at that point, the trader is likely going to want to look at the Nasdaq to see if there may be more juice in that squeeze.
DOW JONES FOUR-HOUR PRICE CHART
(Click on image to enlarge)
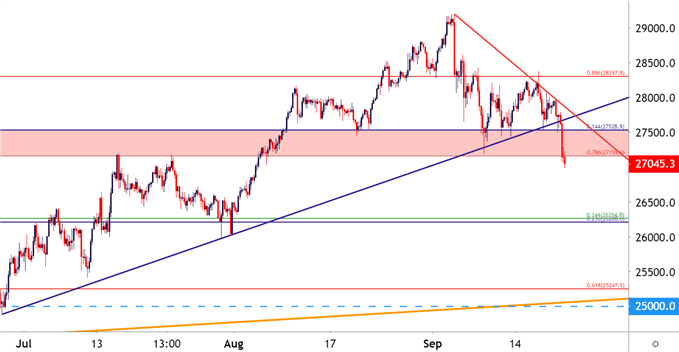
Chart prepared by James Stanley; Dow Jones on Tradingview
Disclosure: See the full disclosure for DailyFX here.


