
Dow Jones Forecast: Boeing's Earnings Could Spell Disaster For The Average
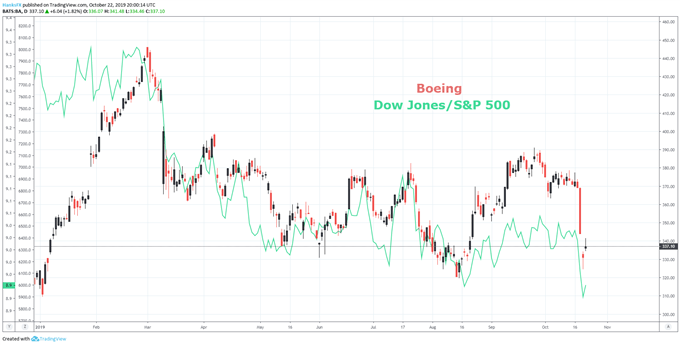
The Dow Jones Industrial Average has lagged its S&P 500 counterpart recently as the Index’s largest constituent, Boeing, falls under continued pressure from the 737 Max debacle. The model, which suffered from a crippling issue that caused the downing of at least one commercial flight, has yet to return to service. Now, Wall Street analysts can no longer defend the corporation’s valuation as the issue begins to weigh on future orders and airlines seek compensation.
(Click on image to enlarge)
Earnings Season: Key Facts to Know & Why it is Important for the Stock Market Outlook
Consequently, analysts have begun to cut price targets for the airplane manufacturer and shares have responded accordingly. In turn, the stock’s influence over the Dow Jones has slipped, with BA shares accounting for just 8.7% of the Index, down from more than 12% a year ago. Nevertheless, Boeing is still the Average’s highest weighted component and is therefore afforded noteworthy price influence.
BOEING PRICE CHART: DAILY TIME FRAME (JANUARY 2018 – OCTOBER 2019) (CHART 2)
(Click on image to enlarge)
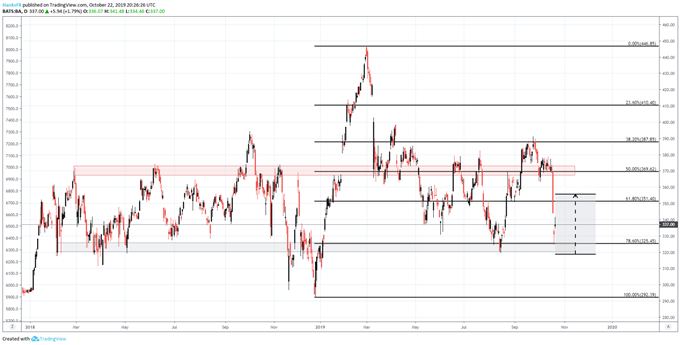
Chart created with TradingView
Therefore, an abysmal quarter from the Chicago-based company could materially threaten the Index’s rally. While the initial reaction to the 737 Max problems was somewhat muted due to the company’s moat and competitive advantage, scandals, costs and lawsuits have continued to mount. If those are reflected in the report, further losses could be expected. Evidently, investors are apprehensive going into the report with the stock’s implied volatility resting at 5.4% - slightly higher than is typically expected from a mega-cap industrial manufacturer.
(Click on image to enlarge)
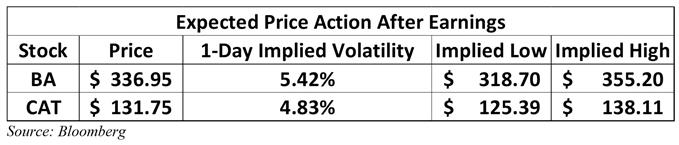
Source: Bloomberg
Conversely, Caterpillar (CAT) is a heavy-equipment manufacturer with a relatively stable background compared to Boeing, but demand has come into question. Viewed as a barometer of global growth by some, Caterpillar offers important insight on the heavy-machinery demand from different geographical regions. Thus, a drawdown in demand in an emerging market like China could exacerbate global growth fears – fears that have been responsible for various instances of risk aversion in recent months.
CATERPILLAR PRICE CHART: DAILY TIME FRAME (NOVEMBER 2017 – OCTOBER 2019) (CHART 3)
(Click on image to enlarge)
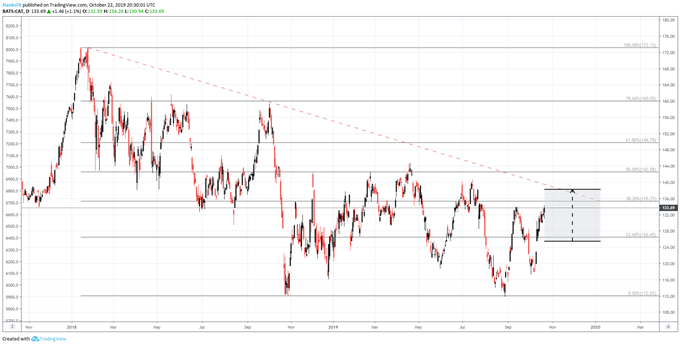
Chart created with TradingView
Regardless of direction, both stocks have been afforded the ability to significantly impact the Dow Jones. Judging by the earnings released on Tuesday afternoon from Snapchat and Texas Instruments, the Industrial Average may wake up with a hangover that the industrials could look to cure if they impress. As it stands, however, the odds seem to be stacked against such an outcome.


