
Dow Jones & S&P 500 Recover, Amazon And Google Earnings Impress
The Dow Jones recorded a second consecutive session of considerable gains, extending the recovery from last week’s rout. Not to be outdone, the S&P 500 enjoyed its best 2-day performance since November. As retail traders seem to relent and normality returns to the US markets, impressive earnings from both Amazon (AMZN) and Alphabet (GOOGL) could help propel the indices higher still.
ALPHABET EARNINGS
Alphabet was first to announce after the close, revealing yet another remarkable quarter with beats on both top and bottom lines. Shareholders were quick to react as shares of Google pushed to new all-time highs in after-hours trading, surpassing $2,000 for the first time.
With an encouraging quarterly report card and the stock price at a record, the outlook for Google in the weeks and months ahead is encouraging. As a key member of the S&P 500 and Nasdaq 100, continued outperformance from Google could help drive growth for the broader indices.
AMAZON EARNINGS
Despite a narrower beat than that delivered by Alphabet, Amazon earnings may overshadow the former in financial news media coverage following a surprise leadership announcement. Amazon founder and longtime CEO, Jeff Bezos, announced he will transition to Executive Chair in the third quarter and Andy Jassy will assume role of Chief Executive Officer.
Alongside his role as a visionary transformed the lives of consumers across the globe, Jeff Bezos ushered in a period of immense gains in Amazon’s share price. That said, Andy Jassy will have massive shoes to fill and shareholders will watch closely and, I suspect, scrutinize viciously. Still, the initial reaction in AMZN shares was a modest gain, suggesting investors were satisfied with the decision to place Mr. Jassy in charge.
Only time will tell how Mr. Jassy handles the new role and what impact it will have on the stock price, but the initial reaction is encouraging and the Nasdaq 100, Dow Jones and S&P 500 seem poised to continue their recovery from last week’s turbulence.
DOW JONES PRICE CHART: DAILY TIME FRAME (DECEMBER 2017 – FEBRUARY 2021)
(Click on image to enlarge)
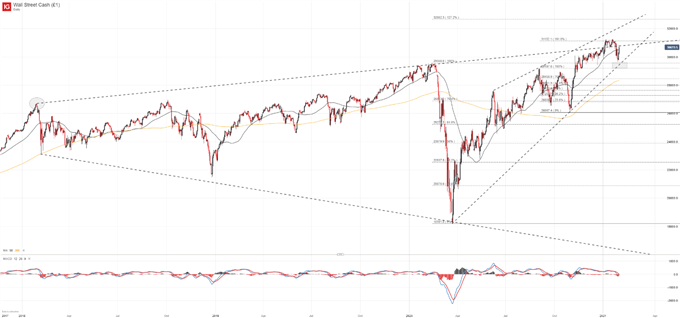
Looking to the technical landscape of the Dow Jones, it seems the Industrial Average has encountered resistance along the trendline originating from January 2018. Trading within reach of record levels, subsequent resistance is rather sparse and may exist only at prior highs near 31,130. Support in the event of a renewed selloff remains situated along the rising trendline from March, around 29,585.
Disclosure: See the full disclosure for DailyFX here.


