
Dow Jones & Nasdaq 100 Wrestle With Resistance, Are They At Risk?
Stocks have endured a bit of back and forth price action this week as traders react to the likelihood of a second stimulus relief package. After initially falling as President Trump announced via Twitter that another program would have to wait until after the election, losses were soon reversed alongside a simultaneous rollback from President Trump. Consequently, it seems fiscal stimulus remains the driving force behind equity markets this week and after all that has transpired, little has been achieved.
Suffice it to say, investors are left with essentially the same questions they had entering the week and the price of the Dow Jones and Nasdaq 100 reflects that. Thus, it seems likely ongoing discussions between Democrats and Republicans regarding stimulus will continue to be the main influencer behind equity price action in the shorter-term. Nevertheless, the Dow Jones and Nasdaq 100 have already begun to probe overhead resistance, does that put them at risk of another reversal?
DOW JONES TECHNICAL OUTLOOK
In the case of the Dow Jones, price has climbed to an important area of support turned resistance. The line was initially derived from the index’s June low but has since reaffirmed its influence after a series of successful holds in October. Critically, the ascending band may mark the topside of a rising wedge – typically viewed as a bearish technical formation.
DOW JONES PRICE CHART: 1 – HOUR TIME FRAME (SEPTEMBER 2020 – OCTOBER 2020)
(Click on image to enlarge)
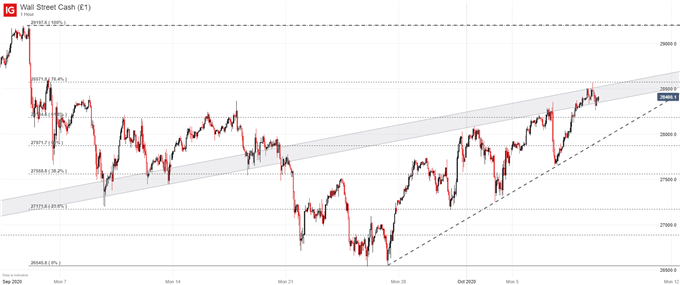
As shown in the chart below, the Dow has worked itself into a rising wedge and may be at risk of a bearish reversal. While it is difficult to make such calls with confidence given the uneasy fundamental landscape and the somewhat unreliable nature of technical patterns, the formation is undoubtedly noteworthy. A technical trader might view the area above the band as a zone of invalidation while looking beneath the rising trendline from late September for areas of interest.
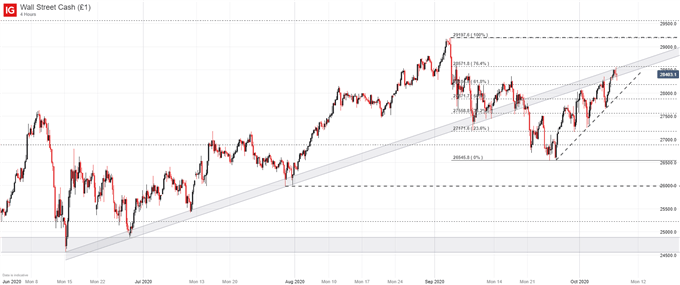
DOW JONES PRICE CHART: 4 – HOUR TIME FRAME (JUNE 2020 – OCTOBER 2020)
(Click on image to enlarge)
NASDAQ 100 TECHNICAL OUTLOOK
The Nasdaq, on the other hand, has developed no such wedge and has instead encountered resistance in the form of a horizontal band derived from prior swing highs around the 11,580 mark. If broken, bulls may look to continue higher with relative ease until possible secondary resistance materializes around the 11,782 area.
NASDAQ 100 PRICE CHART: 1 – HOUR TIME FRAME (SEPTEMBER 2020 – OCTOBER 2020)
(Click on image to enlarge)
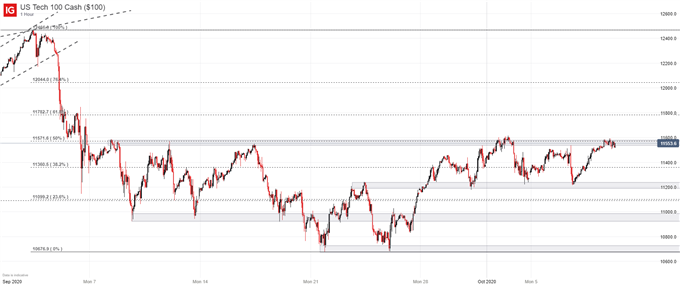
Should bears take control of price action prior to a bullish break higher, the Nasdaq 100 seems to lack notable support until the Fibonacci level at 11,360 and a subsequent area of potential support around 11,200. To be sure, both the Dow Jones and the Nasdaq 100 appear vulnerable at this time, but there is nothing to suggest a bearish reversal is imminent.
Disclosure: See the full disclosure for DailyFX here.


