
Dow Dividend Rising Significantly
Summary
Earnings and dividends have both risen substantially over the past year to record levels. However, dividend increases are lagging earnings by a wide margin.
The P/E ratio and the dividend payout ratio of the DJIA have fallen significantly back towards their respective historical lows.
The changes enacted by the Fed have brought down the yield of the 30 year T bond to the 3.1% level. Lower rates for longer still seem probable.
Dividend increases this year should push the dividend discount value of the DJIA up to 60,000 by mid-year and 63,000 by year-end, compared to a DJIA price of 25,820.
Very Rude Interruption to Last Year's Expectation of DJIA 30,000
What happened to cause the unexpected Christmas flash crash? Fed tightening? Tariff barriers? Trade wars? Year-end rebalancing? Tax-loss selling? The Republican loss in House? Hedgies and momentum players trying to lock in what might have remained of their profits? Brexit? Perhaps a combination of all of the above? Certainly, what was not expected was the Grinch stealing the Santa Claus rally with such speed and viciousness. It provided, however, an excellent buying opportunity.
However, Fundamental Improvements to Hold Sway
With the price of the DJIA having rebounded sharply over the past two months, perhaps this is a good time to see what fundamentals caused such a reversal from the “Christmas Eve, Flash-Crash Massacre”.
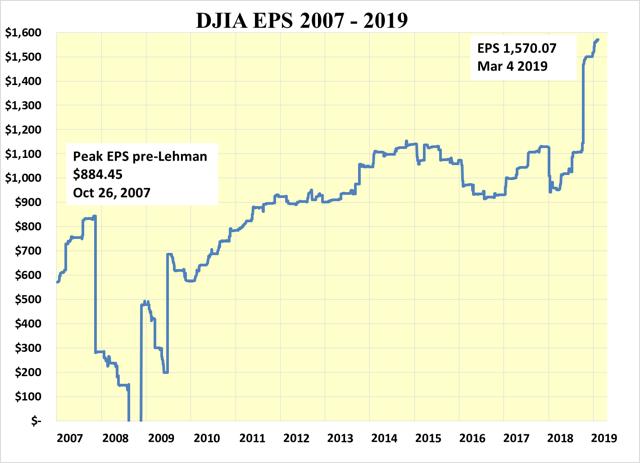
The DJIA earnings have certainly benefited from the late 2017 tax cuts and stand at a record $1,570.07.
(Click on image to enlarge)
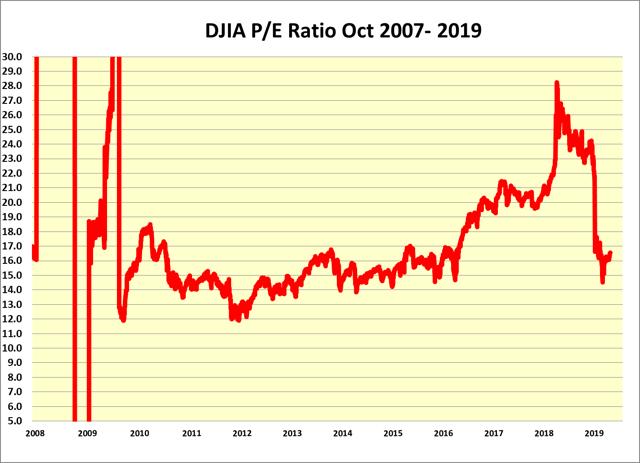
Over the past year, the P/E ratio has fallen back to the levels of the post-Lehman years when following a sharp of recovery earnings immediately after the great recession, both the earnings and the multiple stagnated through 2017.
(Click on image to enlarge)
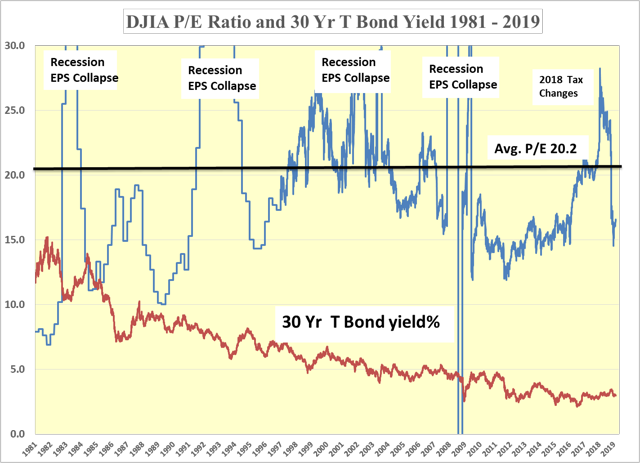
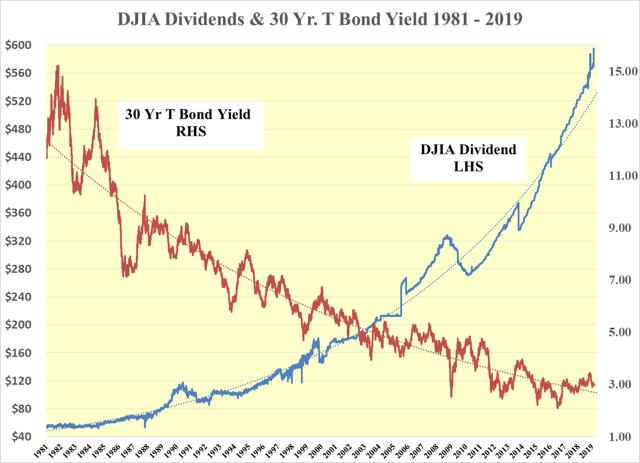
Over the past four decades, the P/E ratio of the DJIA has swung wildly as recessions took their toll on earnings while the 30 year T bond yield has generally fallen from 15.2% in 1981 to the 3.1% level today. The declining 30 year T bond yield pushed up the P/E ratio over time as the discount rate declined until Lehman but not thereafter.
(Click on image to enlarge)
The Dividend Discount Model
While earnings have been volatile, the DJIA dividend has been much less so. Hence, it is the preferred vector to use in the determination of value using the dividend discount model.
(Click on image to enlarge)
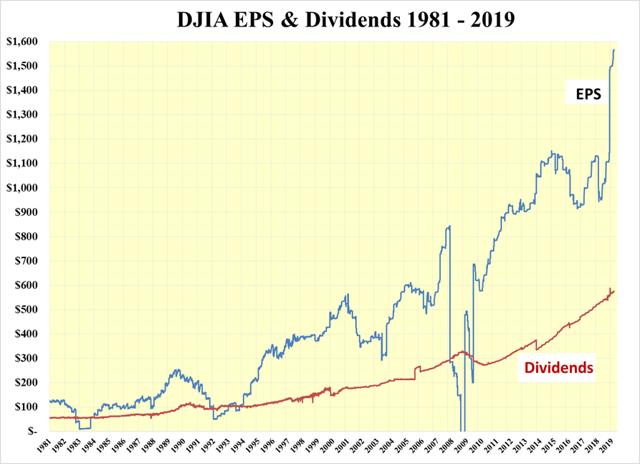
The other vector is the yield of the 30 year T bond which has fallen and pushed up the price of the bond 4.92 times. Simultaneously, the dividend of the DJIA has risen 10.35 times. Multiplying these changes together results in an increase in the dividend discount value of the DJIA of almost 51 times from 848 in September 1981 to 43,180 today. This compares to a DJIA price of 25,820, a 40% discount from its value.
(Click on image to enlarge)
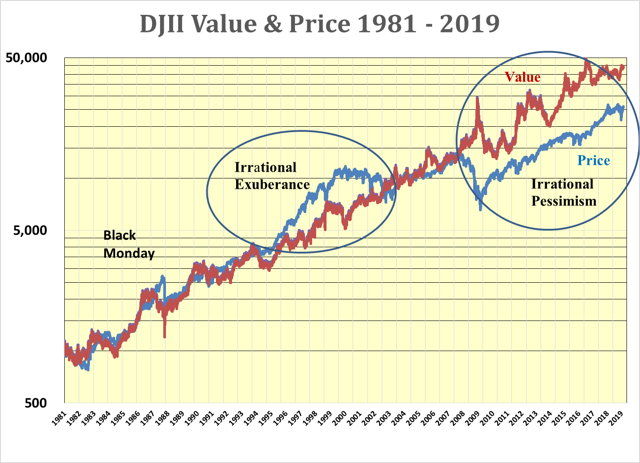
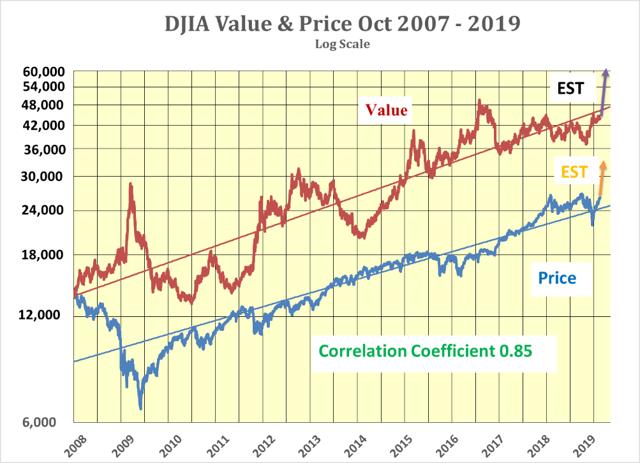
Using these two vectors, it can be seen in the next chart that the dividend discount value of the DJIA and its price are closely matched. The correlation coefficient over the entire period is 0.90. Prior to Lehman, it was 0.94.
(Click on image to enlarge)
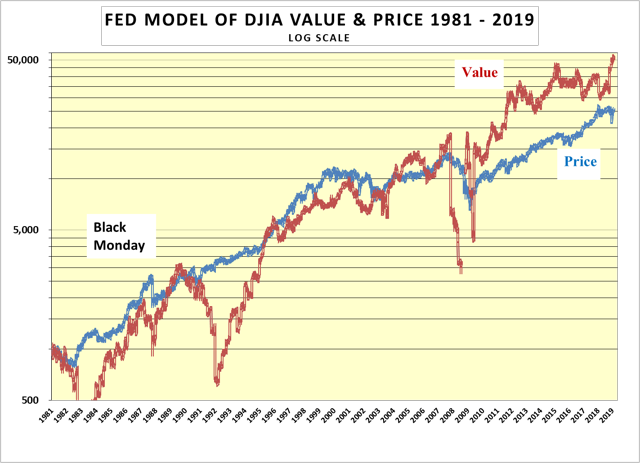
The Fed Model
The Fed model of value is based on the hypothesis that the 30 year T bond yield and the earnings yield should be the same. It uses earnings rather than dividends as one of the two vectors driving value. The result, shown below, demonstrates the impact of recessions on earnings with much greater differences between the value and the price of the DJIA than when the dividend discount model is used.
(Click on image to enlarge)
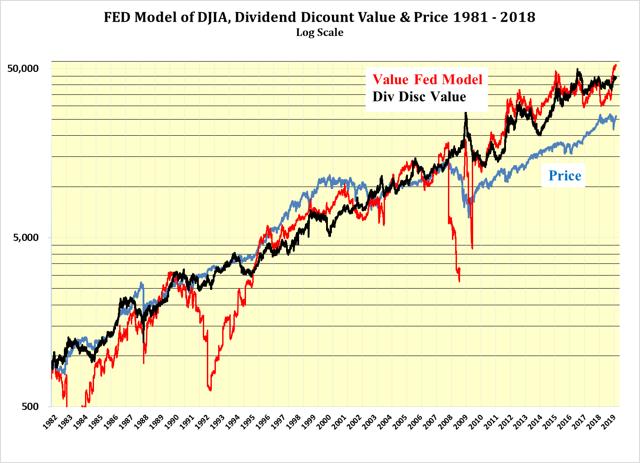
To stress this, the next chart combines both the Fed value model and the dividend discount model and are compared to the price of the DJIA. If the dividend payout ratio were to be held constant, both the Fed model and the dividend discount model would result in the same value. However, earnings have been much more volatile of the two metrics. Hence the preference for the dividend discount value.
(Click on image to enlarge)
Both the Fed model and the dividend discount model show that the pressure on the DJIA price remains decidedly up towards their respective values of 50,811 and 43,180, which are well in excess of the DJIA price of 25,280.
Equilibrium could be achieved by either the value falling or the price of the DJIA rising or a bit of both. In the case of the Fed value, either the yield of the 30 year T bond rises or the earnings falls or again a bit of both.
The strength of the U.S. dollar is now seen as a potential problem and the Fed has greatly eased its drive to QT with both an end to immediate hikes of the Fed Funds rate and an end to balance sheet reductions. This points to continued economic expansion and higher earnings. Birinyi Associates forecast 2019 DJIA earnings in the region of $1,650 which points to a further increase in the Fed valuation as the year progresses.
Using the preferred dividend discount value, the only vector that should change is the dividend and that should increase. At the absolute worst it should remain flat as the dividend payout ratio at 36.8% is down near its historical low.
(Click on image to enlarge)
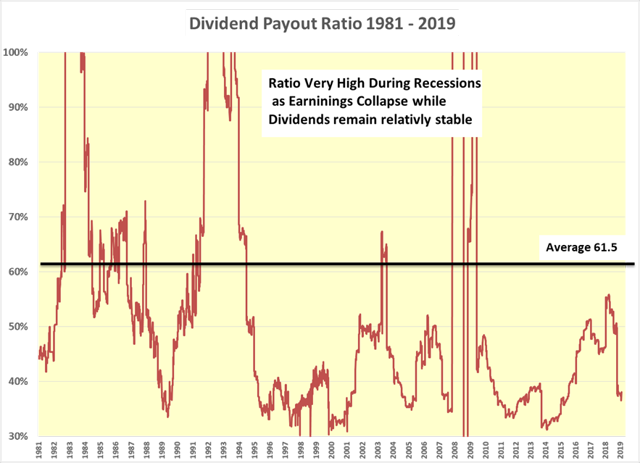
The average payout over the past four decades has been 61.5%. A move to just a 50% ratio would increase the dividend to $782.80 and then to $825.00 by year-end. Assuming no significant change in the yield of the 30 year T bond, the dividend discount value of the DJIA would rise to 60,000 by mid-year and 63,000 by year-end. This should be sufficient to push the price of the DJIA to new high ground as it moves toward equilibrium with its dividend discount value as shown in the following chart:
(Click on image to enlarge)
It could be argued that corporations may just hold their current dividends steady and use surplus cash for either expansion, acquisition, or stock buybacks. Anyone of which should have a positive impact on share prices.
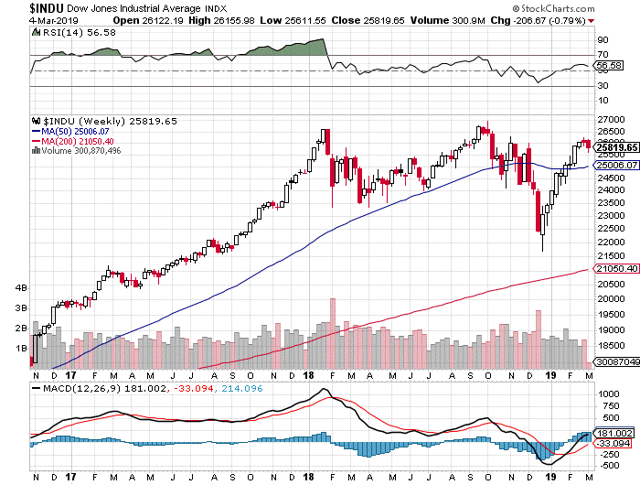
Technically Speaking
On a technical basis, breaching the old high price of the DJIA of almost 27,000 should carry the price to an initial fulcrum swing-over target of 33,500.
(Click on image to enlarge)
The mantra remains:
Buy the DJIA and Take No Prisoners!
Sources: StockCharts. Other charts created by the author from FRED and Dow Jones Data.
Disclosure: I have no positions in any stocks mentioned, and no plans to initiate any positions within the next 72 hours.
I wrote this article myself, and it expresses my own opinions. I am not ...
more

