
Dogs Of The Dow Performance Does Not Keep Pace In 2021
One investment strategy that gets attention at the beginning of each year is the Dogs of the Dow. The Dogs of the Dow strategy is one where investors select the ten stocks that have the highest dividend yield from the stocks in the Dow Jones Industrial Index (DJIA) after the close of business on the last trading day of the year.
Once the ten stocks are determined, an investor invests an equal dollar amount in each of the ten stocks and holds them for the entire next year. The popularity of the strategy is its singular focus on dividend yield.
In this past year, 2021, the strategy did not keep pace with either the Dow Jones Index or the S&P 500 Index. As seen in the table below, the Dow Dogs generated a total return of 16.3% versus 20.8% for the DJIA and 28.7% for the S&P 500 Index.
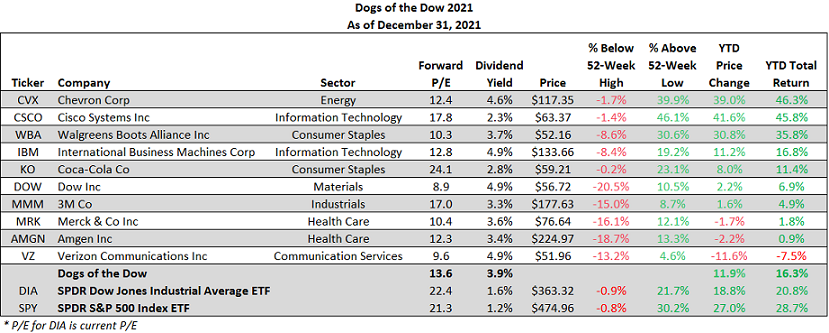
Comparing the Dow Dogs performance to the DJIA Index, the largest detractor to the strategy's performance was the 412 basis point underperformance in the Health Care sector. As the above table shows, both Merck (MRK) and Amgen (AMGN) barely generated a positive total return.
Underperformance also occurred in the Consumer Discretionary sector, i.e., 236 basis points underperformance as the Dow Dog strategy contained no consumer discretionary stocks in 2021, as will be the case in 2022. Energy and Information Technology sectors were both positive contributors to performance, up +221 and + 147 basis points, respectively.
The technology sector's favorable return was generated from the Cisco (CSCO) holding. Consequently, the strong 45.8% return in CSCO has pushed the company's stock dividend yield down to 2.3%. As a result, CSCO is being replaced with Intel (INTC) in the Dow Dog strategy for 2022. INTC has a dividend yield of 2.7%. The other nine Dogs of the Dow remain unchanged from those of 2021.
Finally, and our firm plans to have more on this in our upcoming Quarterly Investor Letter, but 2021 was a strong year for the U.S. equity market. The S&P 500 Index was up 28.7% in 2021 and this follows a 18.4% return in 2020 and a 31.5% return in 2019.
Some might say the market is overdue for a negative year. However, as the below chart shows, it is not uncommon for the equity market to string together five or more positive years in a row.
In fact, in the mid 1990's, six of the nine year positive returning years were up more than 20%. Since the end of the Great Financial Crisis in 2009, the S&P 500 Index has only had one down year and that was a single digit decline of 4.4% in 2018.
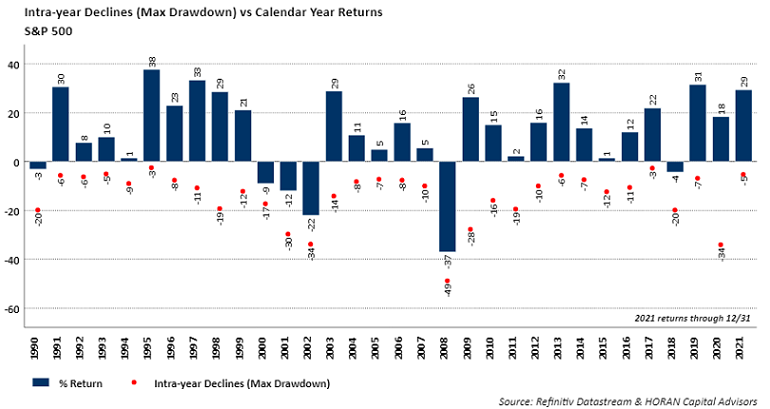
The performance of the equity market and the economy can move in different directions. However, with a current economy that appears to be operating strongly as pent up demand is being satisfied coming out of the pandemic, further economic strength might be in the cards in the coming new year. Economic strength would serve as a tailwind for company performance broadly and possibly another favorable year for equity returns.
Disclosure: Firm and/or family long CSCO, DOW, MMM, MRK, VZ
Disclaimer: The information and content should not be construed as a recommendation to invest or trade in any ...
more

