
Does The Russell 2000 To S&P 500 Ratio Suggest A Coming Recession?
The S&P 500 traded above 3,000 for the first time in history on Wednesday after Fed Chairman Jerome Powell signaled a willingness to sustain the current economic expansion by reducing the Federal Funds rate. Equity markets were jubilant with the Dow Jones and Nasdaq 100 tagging their own record highs alongside the S&P 500. Interestingly, the small-cap Russell 2000 remains well beneath its own all-time high and its ratio to the S&P 500 slipped to the lowest level since April 2008. In the year following the S&P 500 dropped over 43%, but does a return to these levels suggest the S&P 500 is due for similar declines – or possible recession?
SMALL CAPS LAG BEHIND LARGER COUNTERPARTS
(Click on image to enlarge)
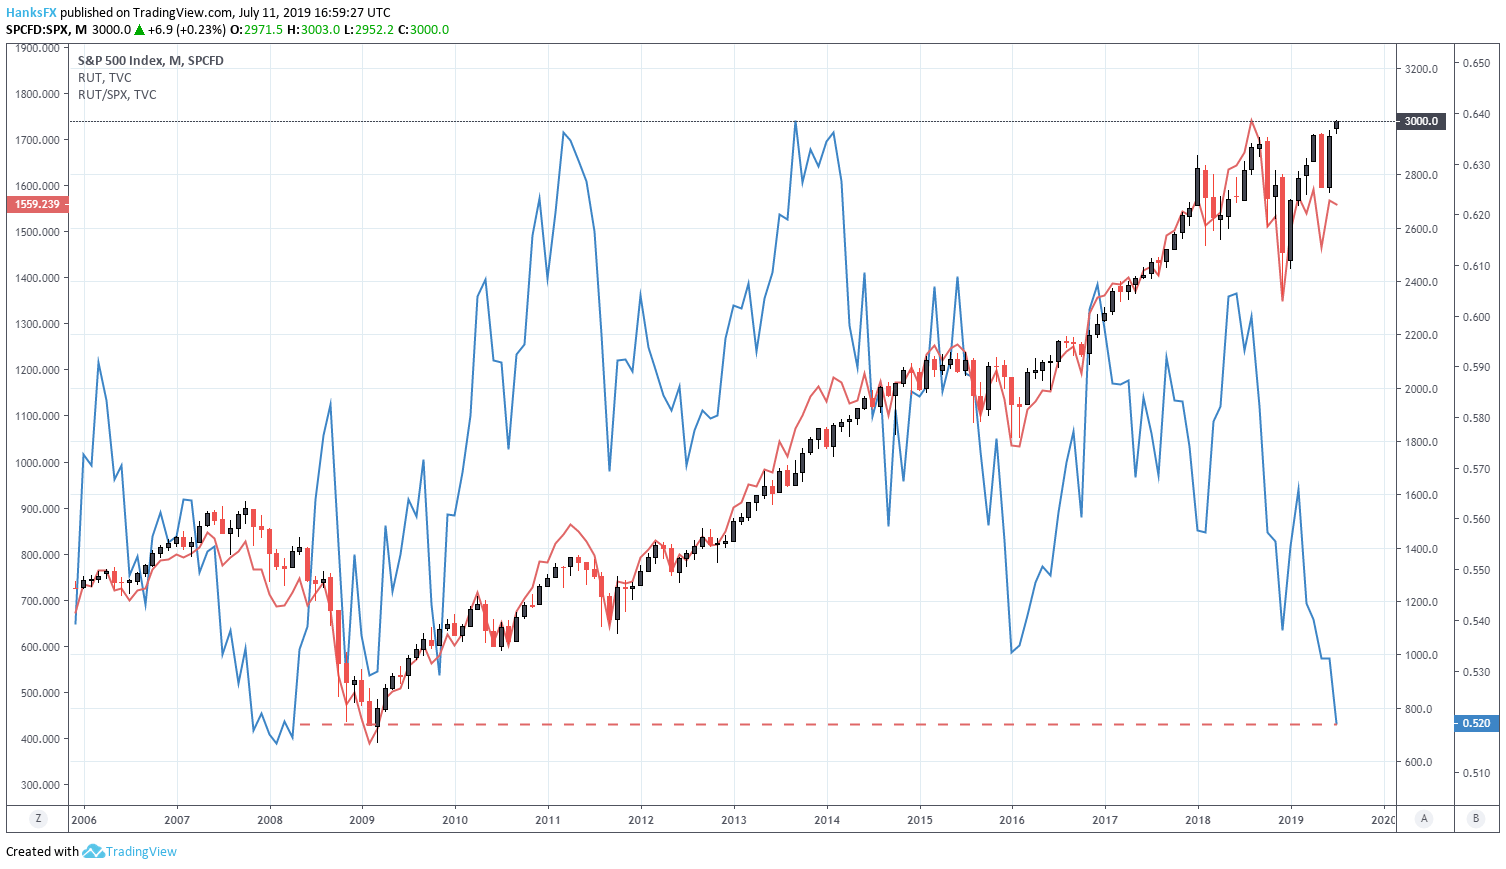
S&P 500 Price Chart Overlaid with Russell 2000 in Red. Russell/SPX Ratio in Blue.
Simply put, it depends. Like with most other things in global financial markets, conflicting themes and the different weights afforded to them make it nearly impossible to isolate a single catalyst. That said, there are clearly some worrisome undercurrents at play, particularly given market conditions that should bolster the ratio - in theory. Arguably the headline factor, small caps are more isolated from international trade than their larger and more international counterparts.
Around the onset of economic hostilities in 2018, many market participants touted the source of earnings for each index as an important discrepancy that could potentially translate to outsized returns for the Russell. Since 2014, the average percentage of sales derived from foreign countries made up roughly 43% of total sales reported by companies listed on the S&P 500 according to S&P Global. The dependence on foreign sales renders the S&P 500 more vulnerable to trade wars than the Russell 2000, which receives around 20% of sales from overseas. Despite the difference in revenue origination, the Russell has not outperformed the S&P 500 since late September.
US DOLLAR (DXY) CORRELATION TO RUSSELL 2000 TO S&P 500 RATIO
(Click on image to enlarge)
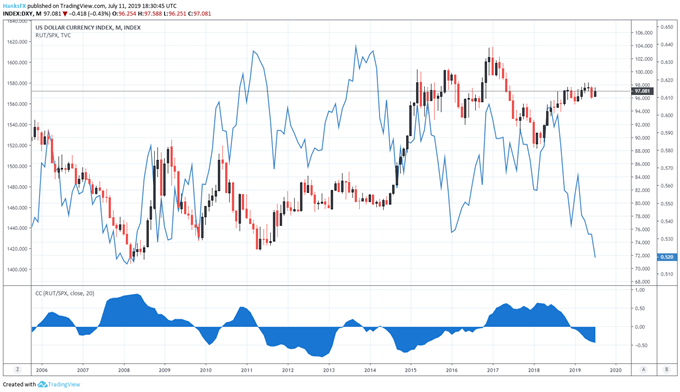
Correlation between DXY and RUT/SPX in blue
Tangentially, some market participants believe a strong US Dollar would result in a stronger Russell/S&P 500 ratio as fewer constituents have to negotiate fluctuating or unfavorable exchange rates. History reveals this logical reasoning carries questionable weight with the correlation between the two fluctuating considerably over time. While the relationship carries a statistically significant correlation at times, other macroeconomic themes can be blamed. In 2019 specifically, the Dollar has a negative correlation with the ratio – suggesting the Russell has not enjoyed an oversized benefit from a stronger Dollar.
ALTHOUGH POTENTIAL TAILWINDS REMAIN, THE RUSSELL LAGS
With the heralded tailwinds behind the Russell wavering but arguably present, why has the Russell lagged the S&P 500 in the most recent rally? In the year-to-date, the S&P 500 has climbed 19% compared to a gain of 15% for the Russell – despite the latter having a beta of 1.2. One possible reason for the Russell’s underperformance is the Index’s weighting by sector.
(Click on image to enlarge)
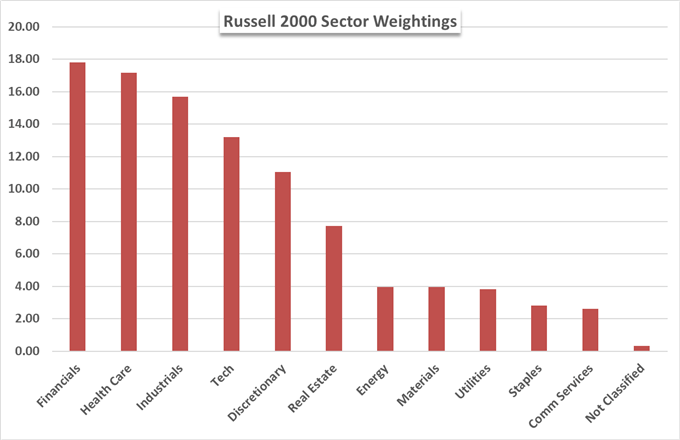
Making up nearly 18% of the Index, the financial sector has weighed as the odds of a rate cut climb. A lower Federal Funds rate translates to slimmer margins for banks, a key profit component for smaller regional banks. Healthcare has also been troubled, falling in the crosshairs of Washington politicians. Finally, other economic indicators are flashing warning signs of their own. An inverted yield curve, deteriorating consumer confidence, and waning manufacturing data are a few examples that have spurred investor concern.
To that end, Russell 2000 constituents typically have weaker balance sheets than S&P 500 components. Should investors hold reservations about upcoming quarters, capital allocation to corporations with high levels of corporate debt is ill-advised and that could be reflected in the recent underperformance. Either way, it would be an exaggeration to suggest the weakening ratio between the two US Indices constitutes a clear-cut recession warning and is more likely just a coincidence that the ratio has aligned with 2008 levels. Still, other warning signs are flashing, so the relationship should not be entirely dismissed.


