
Do We Really Need To W.I.N.?
Just about everybody on the planet expects Jay Powell's Fed to hike the Fed Funds rate by 50 basis points (0.50%) at the conclusion of this week's FOMC meeting tomorrow. Futures predict a 100% chance of such a move and a more than 90% chance of another 50 bp hike at the next meeting in June.
Mr. Powell and his merry band of central bankers are also expected to begin a "QT" (Quantitative Tightening) cycle. For those of you not familiar with the alphabet soup of Federal Reserve acronyms, this means the Fed is going to start selling some of the more than $9 Trillion in bonds it currently owns. The idea is to reduce amount of bonds they bought during the COVID crisis and to return their "balance sheet" back toward some form of normalcy.
In theory, the combination of rate hikes and bond sales will push market rates higher up and down the yield curve. This, in turn, should slow demand for "stuff," which should, again, in theory, cause inflation to fall. Bingo, problem solved.
And why is the Fed suddenly in such a hurry to hike rates and dump bonds on the market? As you may recall, it wasn't that long ago that one Jerome Powell was going out of his way to tell us that the surge in the prices of all kinds of "stuff" we buy was likely to be "transitory."
Well, that was then, and this is now. Now we have a resurgence of COVID in China and the associated lockdowns, which is causing new supply chain issues. Now we have an unfathomable war sponsored by a mad man in Russia, which is creating all kinds of problems, the least of which is a shortage of wheat. Now we have an environment where jobs are plentiful and reports indicate it is fairly easy for workers to swap jobs, getting paid more in the process. Now we have COVID in decline in the good 'ol USofA. Which means now we have increased demand for all kinds of "stuff" and services - oh, and oftentimes not enough "stuff" to meet the demand.
In short, now we have the highest inflation in 40 years. And a Fed that appears desperate to retain their credibility as "inflation fighters".
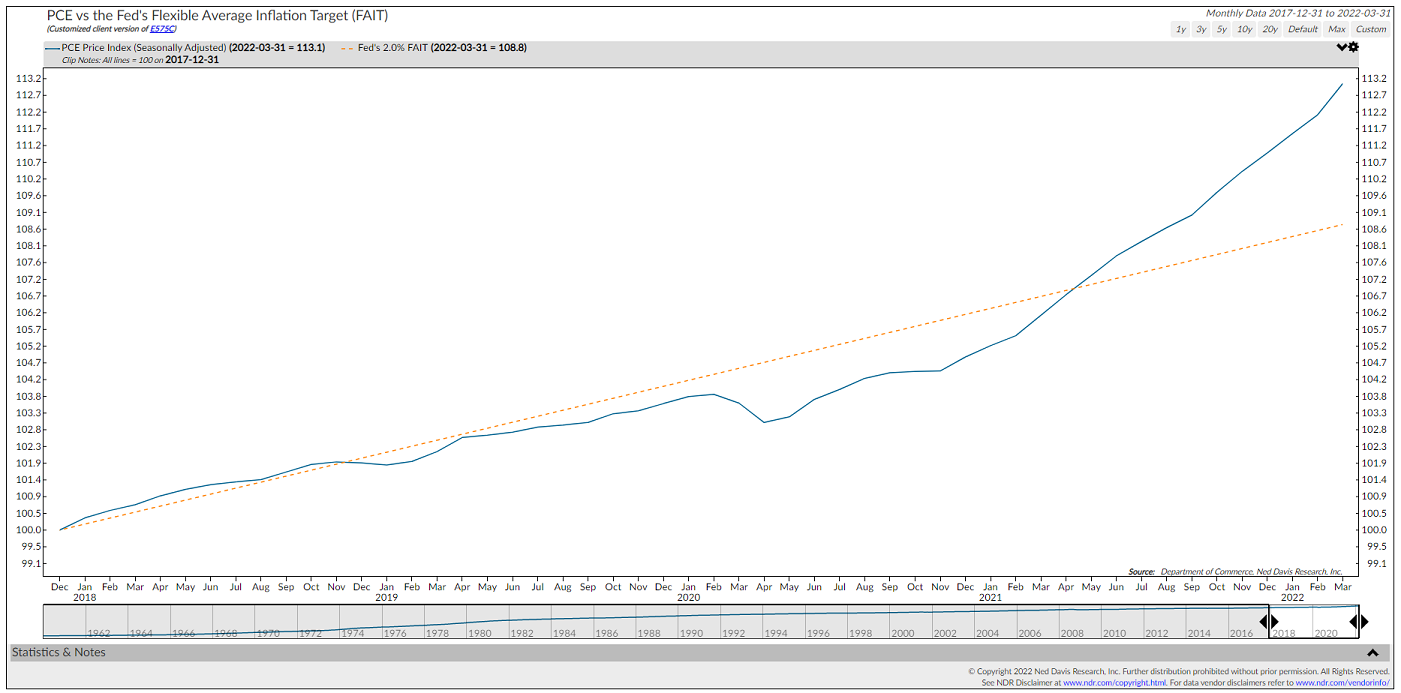
The chart below, from Ned Davis Research illustrates the problem nicely. The blue line is the Fed's favorite measure of inflation - Personal Consumption Expenditures (PCE). The orange dashed line represents the Fed's "target" - I.E. a 2% annualized growth rate of PCE.
PCE vs. Fed 2% Target
(Click on image to enlarge)
Source: Ned Davis Research Group
As you can plainly see, the blue line is WELL ABOVE the orange line. This is an excellent representation of what it means when analysts say the Fed is "behind the curve," or in this case, inflation is way above the trend target.
For those keeping score at home, this "target" is a relatively new thing at the Fed, having been adopted about 10 years ago and reaffirmed by the current Federal Reserve Board in January. In other words, Powell's crew recently confirmed that 2% inflation growth is the goal.
The issue here is the question of what timeframe is being used to calculate and compare to the average. When asked, Chair Powell has basically sidestepped the question, presumably to allow the FED to retain as much flexibility as possible. Makes sense to me.
So, as the chart above shows, it looks like Powell & Company MUST do something to bring down inflation - ASAP! Right?
Never mind the fact that the Fed can't produce any more semiconductor chips, or cars, or houses, etc. Never mind that the Fed can't control COVID. And never mind that the Fed can't keep a raging lunatic from obliterating a country that produces much of Europe's wheat.
Nope. Apparently, the Fed MUST fight inflation - with tools it has, that is. And do so now.
The problem is the economy looks to be starting to slow. As such, the fear is the Fed will go too far and cause a recession - perhaps even on purpose. You know, to "whip inflation now." The Fed has a long history of such an outcome. If memory serves, the Fed has only achieved a "soft landing" (defined as a rate hike campaign that did not end in recession) 3 of the last 11 rate-hiking cycles. Not great odds.
And from my perch, THIS is what the stock market has been worrying about lately. Well, that and the potential for tactical nukes to fly, of course.
Do They Though?
So, the way I see it, while inflation is at 40-year highs, the Fed really can't impact the components of inflation that are very likely to be temporary. And from reports I've seen, things like used car/truck prices are already starting to pull back as the supply of chips improves. Oh, and mortgage rates over 5% might put a crimp in the spike in housing prices. And if rates rise further, prices of homes will surely moderate a bit.
Yet at the same time, there are components of inflation that are indeed likely to be "sticky." As in very sticky. So, some action by the Fed is clearly warranted.
But... And here's my point on this fine Tuesday morning, does the current situation really warrant a "war on inflation?" Is referencing Paul Volcker really appropriate at this juncture? Does the Fed really need to slow demand, which almost by definition means recession? Or is there some wiggle room here?
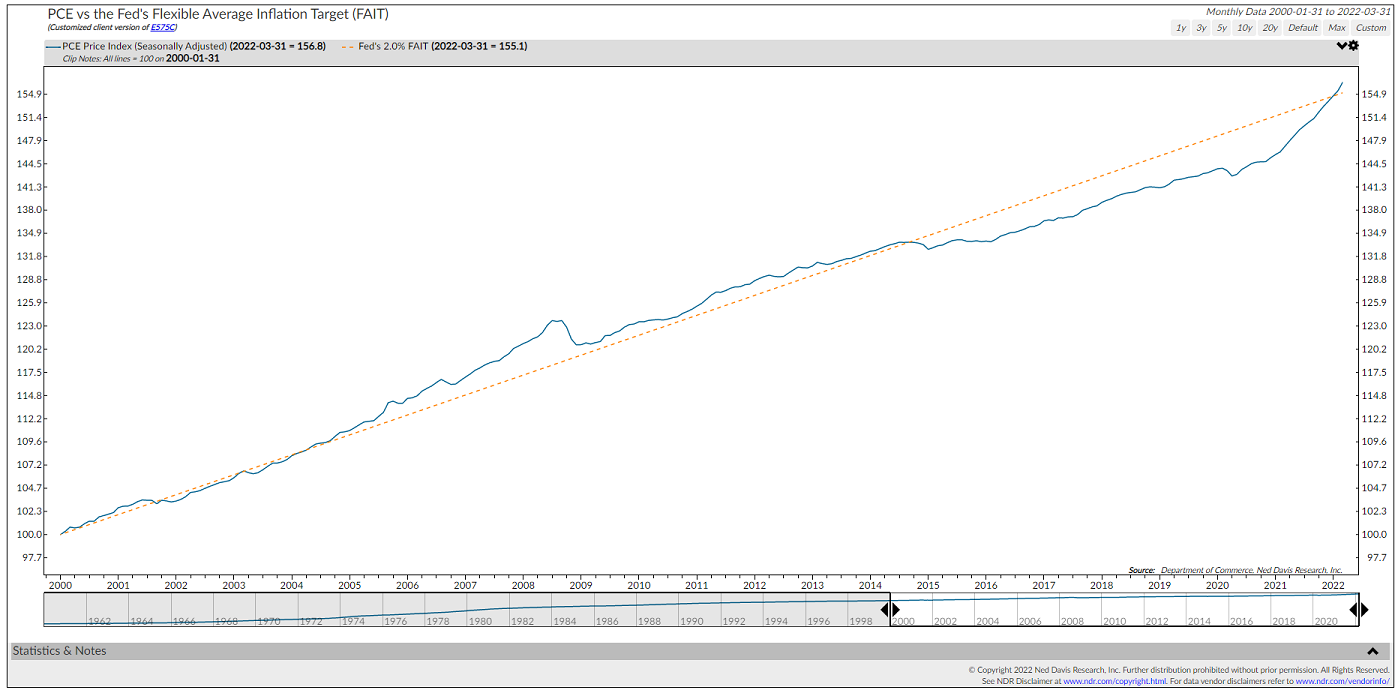
Below is the same chart as shown above. Only this chart looks back to 2000, in order to provide a longer-run perspective on the recent spike in inflation.
PCE vs. Fed 2% Target
(Click on image to enlarge)
Source: Ned Davis Research Group
Different story, right? Instead of suggesting the Fed needs to declare war on inflation now, this chart suggests that inflation is just now returning to its long-term trend - after spending years below the target. That after spending nearly a decade above the trend from 2005 - 2014. Hmmm...
Finally, I saw a survey this morning on CNBC showing that 74% of economists surveyed believe that inflation peaked in May. So, does the Fed REALLY need to "declare war" on inflation at this stage?
Looking on the Bright Side
Put another way, my take is the dire outcomes being projected by analysts - you know, where the Fed goes too far and pushes the economy into the tank - are unlikely to occur. Why? Because in recent history the Fed has not been able to follow through on a sustained/severe rate hike cycle and/or QT.
From my seat, this means that while Powell is sure to hike rates, perhaps significantly so, in the near-term, I wouldn't be surprised to see the Fed back off if/when the economy slows. Remember, the Fed has told us time and time again they are a "data dependent" bunch. And so far, at least, Jay Powell has not given us any reason to believe that he and his cohorts will ignore future data and become overly stubborn in their quest to whip inflation.
It is for this reason, that I'm looking on the bright side and expecting a better back half of 2022. Fingers crossed!
Now let's review the "state of the market" through the lens of our market models...
The Big-Picture Market Models
We start with six of our favorite long-term market models. These models are designed to help determine the "state" of the overall market.
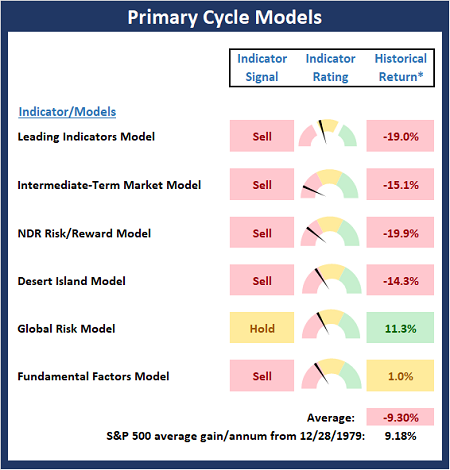
* Source: Ned Davis Research (NDR) as of the date of publication. Historical returns are hypothetical average annual performances calculated by NDR.
The Fundamental Backdrop
Next, we review the market's fundamental factors including interest rates, the economy, earnings, inflation, and valuations.
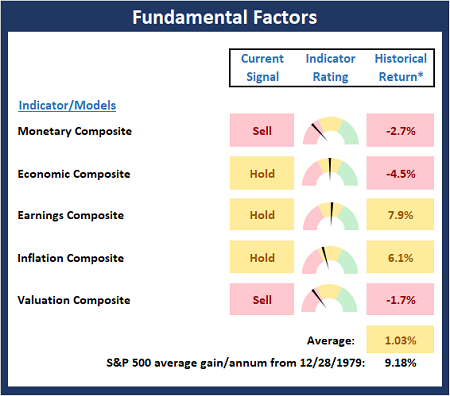
* Source: Ned Davis Research (NDR) as of the date of publication. Historical returns are hypothetical average annual performances calculated by NDR.
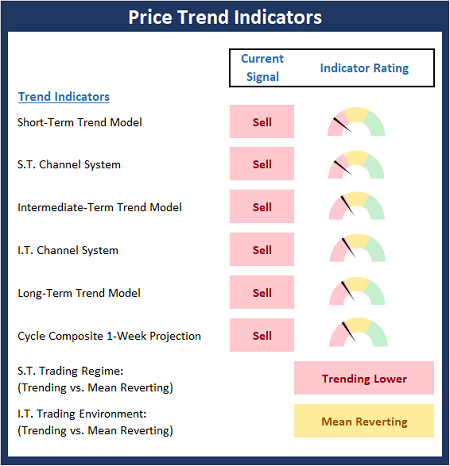
The State of the Trend
After reviewing the big-picture models and the fundamental backdrop, I like to look at the state of the current trend. This board of indicators is designed to tell us about the overall technical health of the market's trend.
The State of Internal Momentum
Next, we analyze the momentum indicators/models to determine if there is any "oomph" behind the current move.
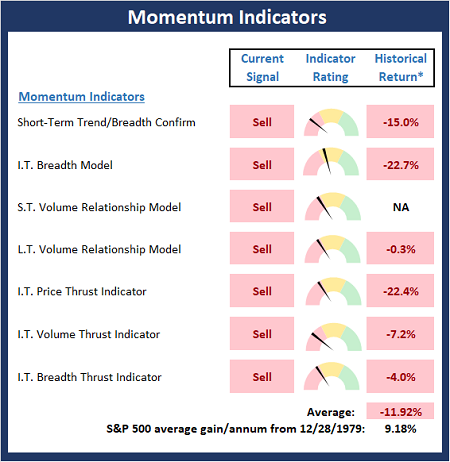
* Source: Ned Davis Research (NDR) as of the date of publication. Historical returns are hypothetical average annual performances calculated by NDR.
Early Warning Indicators
Finally, we look at our early warning indicators to gauge the potential for countertrend moves. This batch of indicators is designed to suggest when the table is set for the trend to "go the other way."
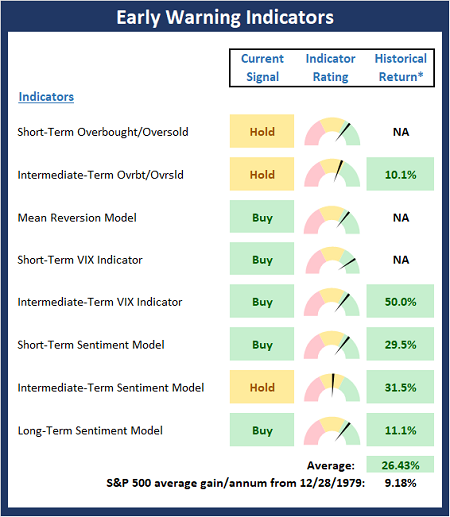
* Source: Ned Davis Research (NDR) as of the date of publication. Historical returns are hypothetical average annual performances calculated by NDR.
The opinions and forecasts expressed herein are those of Mr. David Moenning and may not actually come to pass. Mr. Moenning's opinions and viewpoints regarding the future of the markets should ...
more

