
DJIA Poised For Run To 30,000 In Second Half 2018
Summary
Q4 2017 headline earnings were hit badly by U.S.tax changes. The declines started to reverse with the reporting of Q1 2018 results. This should continue with Q2 earnings being reported this month.
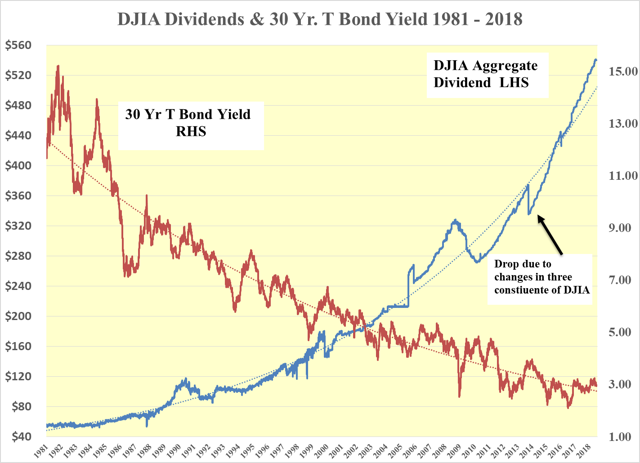
Higher earnings should give great support to the belief that the aggregate DJIA dividend is secure and new records should be achieved as 2018 progresses.
Couple secure and higher dividends with downward pressure on the yield of the 30-year T bond, and the DJIA should strengthen. A DJIA price of 30,000 is still seen.
Many Observations Made as QE Drew to a Close in 2014 Still Valid
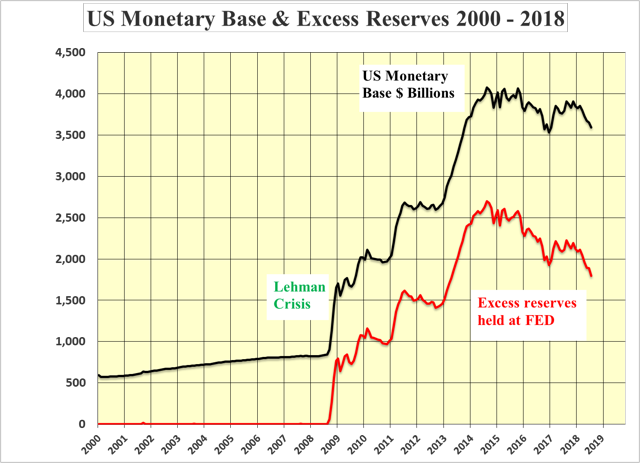
The post-Lehman quantitative easing ended in August 2014 with the US monetary base peaking at $4.075 trillion. In May of that year, I published an article that looked at the huge excess of commercial bank reserves that had built up at the Fed. The US monetary base had grown 5 fold in 5 years from $0.8 trillion in 2008 to $4 trillion.
The commercial banks had built up surplus reserves of $2.6 trillion. While this had never happened before, it was thought to be too early to conclude that “This time it is different”. It was just taking a lot longer than previously for the money created by the Fed to pass through into the economy.
At the time it appeared there that there was a chronic lack of demand for all the newly created money and that in turn would mean lower than anticipated economic growth, inflation, and interest rates as well as much higher equity prices which could all be with us for a good number of years.
In May 2014 it was postulated that the conditions should result in:
- Weaker GDP growth than might have been expected from the monetary stimulus
- Steady inflation, which since then has risen by an average of 1.44% per annum.
- Inflation would be helped by a lower oil price which averaged US$106 vs $76 today
- Steady 30 year T Bond rates which averaged 3.39% in May 2014 and is at 2.96%
- A steady gold price which averaged US$1,288 per oz. vs. US$1,254 today.
- Much stronger equities, the DJIA stood at 16,400 vs. 24,920 today
Over the past four years, the results have been much as expected and stem from the continuing reluctance of banks to do their traditional job of pushing the increase in the monetary base into the economy by lending the newly created money to corporations and individuals.
Actual Working Monetary Base (AWMB)
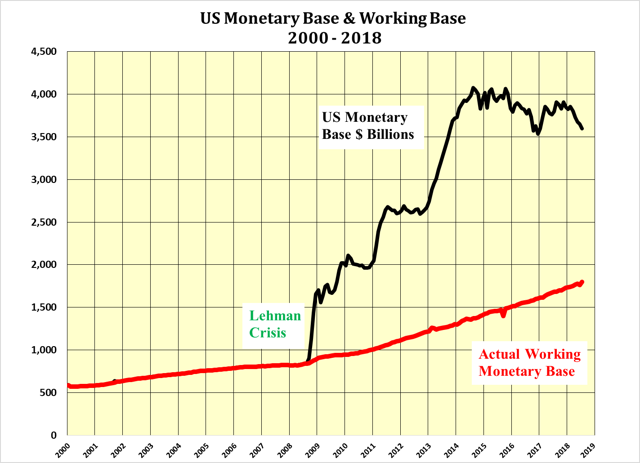
Subtracting the excess reserves of $1.8 trillion held at the Fed from the total US monetary base of $3.6 trillion is shown in the next chart. The red line represents the amount of the monetary base that has managed to make it through to the economy it stands at $1.8 trillion, up US1.0 trillion since Lehman, leaving most of the money created not flowing through to the real economy.
Trajectory of AWMB very similar to that of Currency in circulation
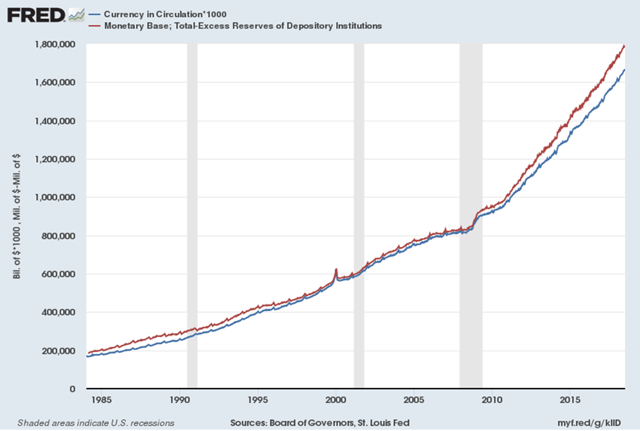
The AWMB and the amount of US currency in circulation have tracked very similar paths. With the AWMB leading the way, particularly post Lehman. Neither is showing any signs of turning down. Indeed, the rate of increase of the AWMB could well be starting to accelerate as the Fed continues to encourage the banks to push their excess reserves out into the real economy.
The reluctance of the banks to do their job stemmed from a combination of changes in regulations as well as fear on the part of banks, consumers and businesses and the preference of the banks to hold their excess reserves at the Fed, where since Lehman interest has been paid on such reserves. The rate of interest paid on excess reserves (IOER) has been increased in line with the Fed Funds rate until June 2018 when it was increased by only 0.20% to 1.95%.
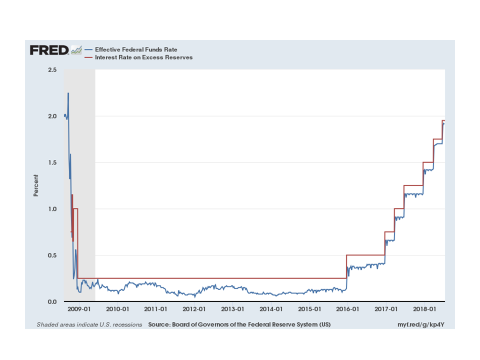
The lower than expected increase of the IOER points to the Fed wanting to speed up the deployment of the created monetary base. This should result in an acceleration of economic growth led, perhaps, by capital spending in the oil patch including the Keystone XL pipeline and unblocking the transportation logjams in the Permian Basin. Oh, Canada! That you too, could improve our own oil patch!
Yield Curve Flattening as Long Rates Pushed Down
Although there has been little comment on this small adjustment to the IOER it is seen as highly significant as a first move by the Fed to start pushing the excess reserves out along the yield curve and into the real economy. While this is happening on the long end of the curve the Fed is simultaneously raising short rates. The result is a flattening of the yield curve to under 30 basis points between the 2 year and 10-year treasuries.
Some would argue that this portends a recession within the next year to eighteen months. While a flattening or an inverted, yield curve has often preceded recessions in the past it has not been the result of the long rates being pushed down as is now the case. Rather, short rates were pushed up and long rates were dragged up in their wake. The extreme example was in 1981 when the Funds rate hit 22% and the 30 year T bond rate peaked at 15.2%.
Lower Long-Term Rates Positive for Equity Values
Low inflation and low long-term rates are extremely positive for equities where stock prices were, and are, well below their FED-model and dividend-discount values both in 2014 and today. The argument for the lower than expected stock prices is that interest rates are being held artificially low. Whereas the reality of 2014 and today appears to be that the demand for money is well below its supply and the price of money, interest rates in the domestic market, are properly reflecting this imbalance.
The dividend discount model is preferred to the Fed model as the latter is dependent on earnings which are much more volatile than dividends when recessions strike.
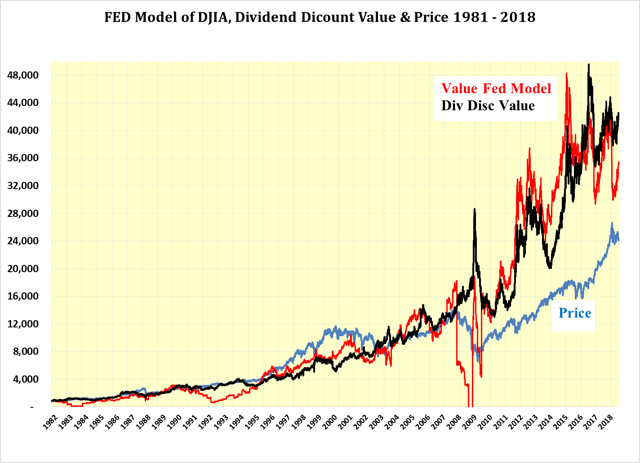
DJIA Value Driven by Dividends & 30 Yr. T Bond Yields
Equities Prices Remain at Significant Discounts to Values
In short, equity markets remain priced at significant discounts to their value as measured both the dividend discount model and the Fed model. One of the oft-stated reasons for this is that interest rates are being held artificially low by the Fed. However, the Fed has only control of very short-term rates and as demonstrated above long rates are a function of supply and demand.
Supply is more than abundant while demand is insufficient to sop up the excess supply. As it could take several years for demand to grow to the level where all of the excess reserves are utilized, long-term interest rates should remain low around the 3% level plus or minus 0.25%
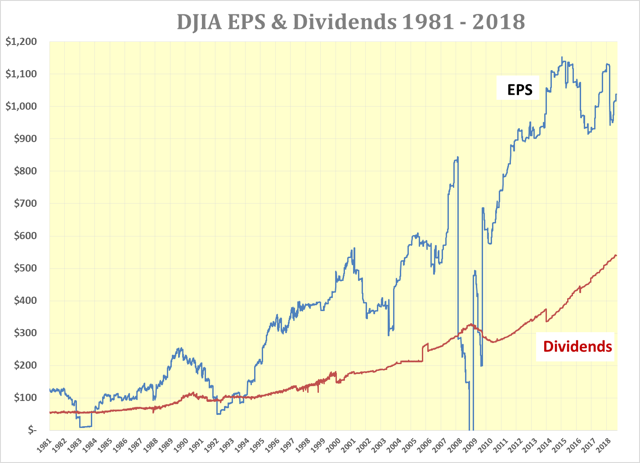
New Tax Act Good for Headline EPS in 2018 but Very Negative In Q4, 2017
The new U.S. Tax Act should lower corporate taxes and increase earnings in 2018 and beyond. However, there were a number of one-time, write-offs that impacted negatively headline earnings in Q4 the fourth quarter of 2017. The 52-week trailing earnings of the DJIA thus fell and gave the impression that another earnings recession was upon us. Disappointing many market participants as there has been no increase in earnings since 2014.
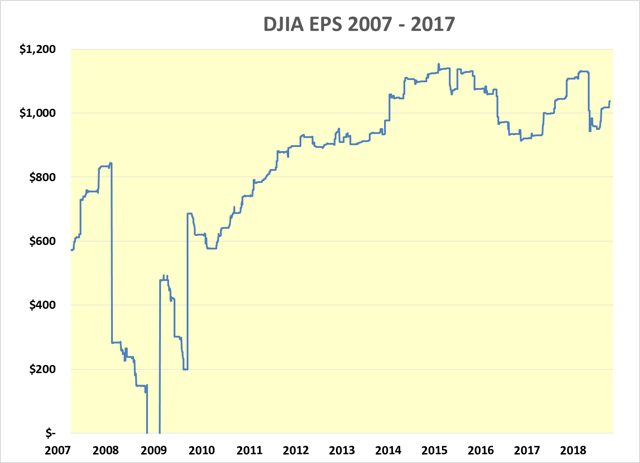
Earnings rebounded partially in Q1 2018 and should continue to do so for the remainder of the year. Q2 2018 should show a considerable improvement over Q1 2018. By the time Q4 2018 is reported in January and February 2019, the aggregate earnings of the DJIA should be at a new record level. This should boost considerably the Fed value of the DJIA and should give comfort to the security of the current record level of dividends and even lead to further dividend hikes.
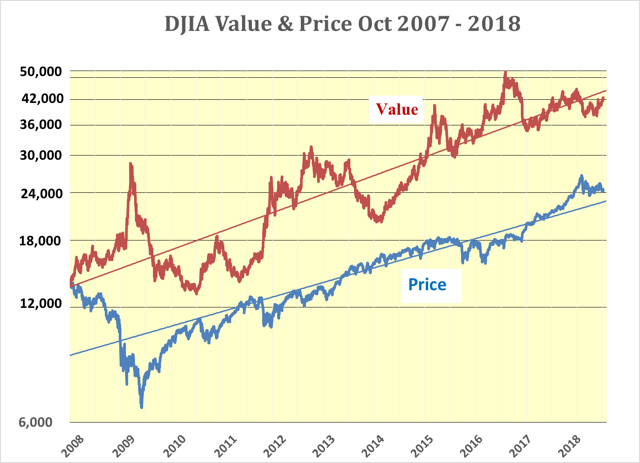
The dividend-discount value, at 42,132, is still well above its price of 24,920. So, BUY now and new highs should be seen as Q2 2018 earnings are released this month as well later this year and into 2019. There still remains a strong possibility that the DJIA price will hit 30,000 in 2018 and 40,000 in 2019 as headline EPS recover and dividends are seen to be not only secure but also rising to new record levels.


