
Dillard's - All Time High
Summary
- 100% technical buy signals.
- 4 new highs and up 63.18% in the last month.
- 411.73% gain in the last year.
- Even though Wall Street analysts and individual investors are negative on this stock it just keeps rising.
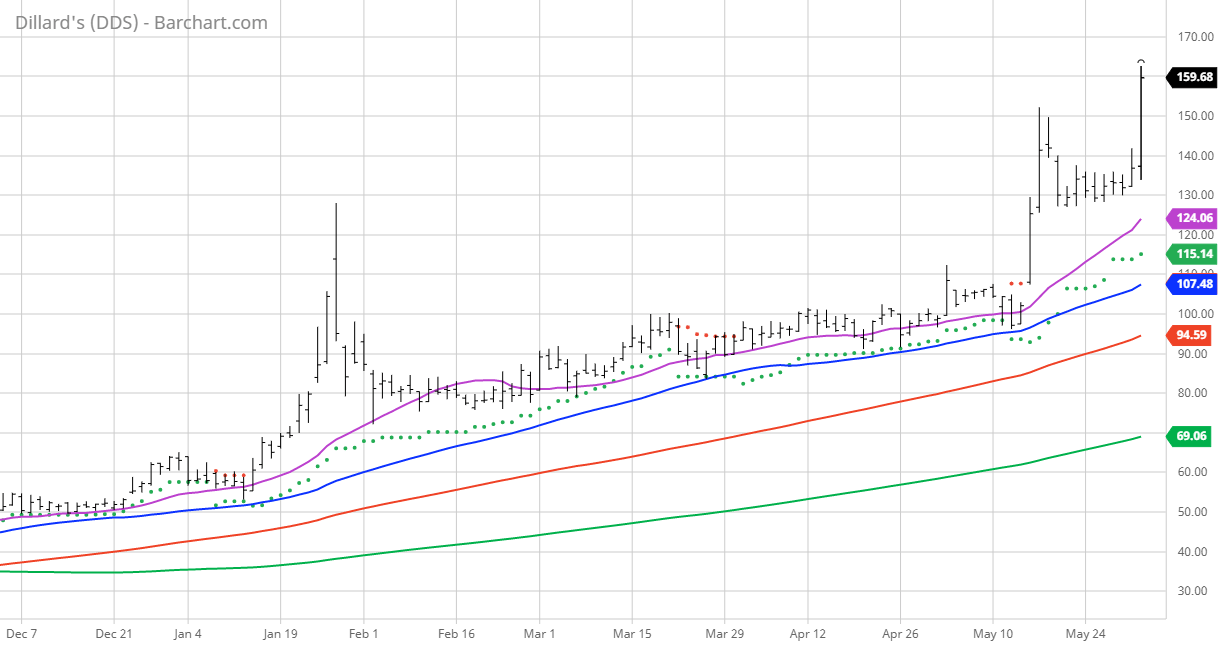
The Barchart Chart of the Day belongs to the department store chain Dillard's (NYSE: DDS) which hit a New All-Time High again today. I sorted Barchart's All-Time High list first by the highest Weighted Alpha, then used the Flipchart function to review the charts for consistent price appreciation. Since the Trend Spotter signaled a buy in 5/14 the stock gained 29.43%.
Dillard's, Inc. ranks among the nation's largest fashion retailers. The Company focuses on delivering style, service, and value to its shoppers by offering compelling apparel, cosmetics, and home selections complemented by exceptional customer care. Dillard's stores offer a broad selection of merchandise and feature products from both national and exclusive brand sources. Dillard's, Inc. ranks among the nation's largest fashion retailers. The Company focuses on delivering style, service and value to its shoppers by offering compelling apparel, cosmetics and home selections complemented by exceptional customer care. Dillard's stores offer a broad selection of merchandise and feature products from both national and exclusive brand sources. As of January 30, 2021, the company operated 282 Dillard's stores, including 32 clearance centers, and an Internet store at dillards.com. It also engages in the general contracting construction activities. The company was founded in 1938 and is based in Little Rock, Arkansas.
Barchart technical indicators:
- 100% technical buy signals
- 413.46+ Weighted Alpha
- 411.73% gain in the last year
- Trend Spotter buy signal
- Above its 20, 50 and 100 day moving averages
- 4 new highs and up 63.18% in the last month
- Relative Strength Index 76.86%
- Technical support level at 132.14
- Recently traded at 161.74 with a 50 day moving average of 107.51
Fundamental factors:
- Market Cap $3 billion
- P/E 12.08
- Dividend yield .45%
- Revenue expected to grow 33.50% this year and another 1.60% next year
- Earnings estimated to increase 443.50% this year, decrease by 38.60% next year and continue to shrink by an annual rate of 21.48% for the next 5 years
- Wall Street analysts issued 2 hold and 3 underperform recommendations on the stock
- The individual investors rating th stock on Motley Fool are negative with 150 bulls against 244 bears
- 8,180 investors are monitoring the stock on Seeking Alpha.
Disclaimer: The Barchart Chart of the Day highlights stocks that are experiencing exceptional current price appreciation. They are not intended to be buy recommendations as these stock are ...
more

