
CorVel - Chart Of The Day
Summary
- 100% technical buy signals.
- 19 new highs and up 1587% in the last month.
- 51.42% gain in the last year.
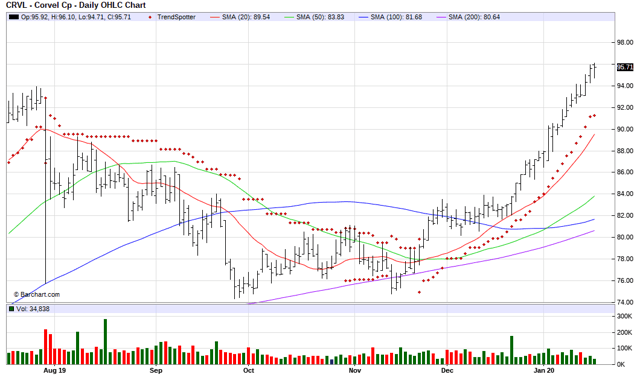
The Barchart Chart of the Day belongs to the insurance and business services company CorVel (CRVL). I found the stock by sorting Barchart's New All-Time High list first by the most frequent number of new highs in the last month, then used the Flipchart feature to review the charts for consistent price appreciation. Since the Trend Spotter signaled a buy on 11/22 the stock gained 19.83%.
CorVel Corporation is an independent national provider of innovative workers' compensation, auto, liability and health solutions for employers, insurance companies, third party administrators, and government agencies seeking to control costs and promote positive outcomes. The Company applies technology, intelligence, and a human touch throughout the risk management process so their clients can intervene early and often while being connected to the critical intelligence they need to proactively manage risk. The Company's services include automated medical fee auditing, national preferred provider network, early intervention, utilization review, medical case management, vocational rehabilitation services, telephonic case management, and independent medical examinations. With a robust technology platform at its core, their connected solution is delivered by a national team of associates who are committed to helping clients design and administer programs that meet their organization's performance goals.
(Click on image to enlarge)
Barchart's Opinion Trading systems are listed below. Please note that the Barchart Opinion indicators are updated live during the session every 10 minutes and can, therefore, change during the day as the market fluctuates. The indicator numbers shown below, therefore, may not match what you see live on the Barchart.com website when you read this report.
Barchart technical indicators:
- 100% technical buy signals
- 51.87+ Weighted Alpha
- 51.42% gain in the last year
- Trend Spotter buy signal
- Above its 20, 50 and 100 day moving averages
- 19 new highs and up 15.87% in the last month
- Relative Strength Index 91.13%
- Technical support level at 94.60
- Recently traded at 95.80 with a 50 day moving average of 83.83
Fundamental factors:
- Market Cap $1.75 billion
- P/E 36.70
- Wall Street is not following this stock
- The individual investors following the stock on Motley Fool voted 54 to 8 that the stock will beat the market
- 586 investors are monitoring the stock on Seeking Alpha
Disclosure: None.


