
Consumers Love The Stock Market
Strong Preliminary February Consumer Sentiment
Consumer confidence readings were all fantastic in January. But that didn’t lead to a great retail sales report. Yearly growth was bogged down by online sales growth. It had a big sequential decline, but obviously still had yearly growth above the headline reading. However, that won’t stop me from continuing to read the tea leaves in hopes of finding clues about the health of the consumer.
University of Michigan's consumer sentiment reading was fantastic as it surpassed last month’s reading. The index was up from 99.8 to 100.9 which is only slightly below the expansion high set in March 2018 which was 101.4. It was the second-highest reading of this expansion but below the record high of 112.
Current conditions fell from 114.4 to 113.8 and the expectations index rose from 90.5 to 92.6 (also the 2nd highest of this expansion). The highest reading ever was 108.6. Both categories and the headline index rose substantially from last year because we are lapping the weakness caused by the government shutdown. Coronavirus didn’t hurt sentiment as it was voluntarily mentioned by only 7% of consumers. It's doubtful it will ever hurt consumer spending significantly.
You can tell the roaring stock market positively impacted this report since personal finances and viewpoints on the economy increased sharply. Net percentage change in household income and wealth rose to a new record high (since 1960). A rise in household wealth undoubtedly explains why consumers are optimistic about the stock market.
As you can see from the chart below, the median value of U.S. stock market investments has spiked to $197,258. Don’t get scared into thinking a crash is coming because consumers own a lot of stock. Focus instead on valuations (high but not in a bubble) and the odds of a recession which are low.
(Click on image to enlarge)

Percentage of consumers who think the stock market will increase in the next month rose to 66.3%. That’s slightly below the record high (since 2002) which occurred prior to the volatility in late January 2018. The good news is the AAII investor sentiment survey isn’t showing equally high optimism. There are 3.3% more bulls than average and 4.1% fewer bears than average. If surveys contradict each other, look at valuations. As you can see from the chart below, the S&P 500’s forward PE ratio is 19 which is elevated, but not in bubble territory.
(Click on image to enlarge)

A strong stock market might not help spending. Buying conditions for household durables fell sharply which is a bad sign for the February retail sales report. 10% of consumers mentioned the election voluntarily. I predict that will rise in the coming months but won’t hurt spending.
Very Solid Empire Fed Index
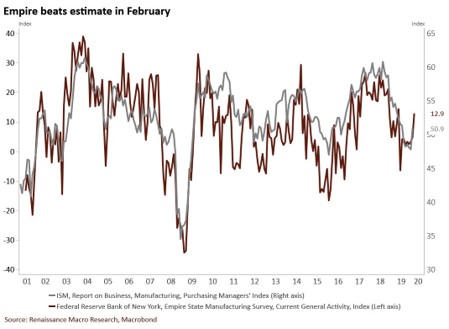
Industrial production report showed some signs of improvement. But it wasn’t nearly as strong as the regional Fed indexes. Now we are starting to get the results from the February regional Fed indexes. As always, we start with the Empire Fed report which was very solid. It built on the improvement from last month.
As you can see from the chart below, the general business conditions index rose from 4.8 to 12.9 which beat estimates for 4.0 and the highest estimate which was 5.1. I think yearly industrial production growth will be positive based on this report and the easier comp. That can change once the other soft data reports are released later this month and in early March.
As you can see from the chart below, this is the equivalent of the ISM PMI rising to the low to mid-50s. That would further confirm a manufacturing recovery in 2020. There hasn’t been enough weakness due to the coronavirus to keep the Empire Fed index down.
(Click on image to enlarge)
New orders index spiked from 6.6 to 22.1 and the shipments index rose from 8.6 to 18.9. These readings were so strong they are consistent with the strength seen in 2018. That was a fantastic year for the ISM PMI, but it was not great for stocks. The stronger the ISM PMI is, the worse equity returns are.
Margins likely improved as the prices paid index fell 6.5 points to 25 and the prices received index rose 2.3 to 16.7. There was modest weakness in the expectations category as the general business conditions index fell 0.7 to 22.9. New orders index fell 3.9 to 27.5 and the shipments index fell 6.2 to 26.5. Capex and technology fell 3.3 and 1.4 to 22 and 21.2.
Housing Market Index Falls Slightly
There was another strong housing market index as it fell from 75 to 74 in February which missed estimates by a point. As you can see from the chart below, this index is very close to the cycle top it hit 2 months ago which was 76. Present sales index fell 1 point to 80 and the next 6 months sales index fell 1 point to 79.
Traffic of prospective buyers index also fell 1 point from 58 to 57. Now let’s look at each region. Northeast rose 5 points to 67. Nothing against the Northeast, but that’s not the region you want to see improving rapidly as it is a very small housing market. Biggest are in the South and the West which rose 2 points to 79 and fell 4 points to 82. Finally, the Midwest index fell 5 points to 62.
(Click on image to enlarge)

Conclusion
Consumer sentiment is very strong, the manufacturing sector is rebounding, and homebuilders are still very confident. On the negative side, the S&P 500’s forward PE ratio is 19. As the cycle continues to improve, we are more likely to see lower future returns. My current expectation is for a 7% gain in the S&P 500 this year.
Since the market is up 4.32% year to date, that’s only about a 3% increase in the rest of the year. 3% in 10 months is relatively bearish because a high ISM PMI is correlated with low returns.
Disclosure: None.


