
Competitive Advantages Drive Sweet Growth Opportunities
As more investors fear a reversal of the huge market gains since mid-March, they should look to get defensive with their portfolio. This consumer goods firm holds an industry-leading market share and is seeing increased demand amid the COVID-19 pandemic. The firm is leveraging strong cash flows to invest in future growth opportunities. Best of all, the stock is currently priced as if profits will permanently decline by 20%.
Investors overlooking The Hershey Company (HSY: $142/share) are in the Danger Zone. Despite rebounding from its March lows, there’s still value in this Long Idea.
Snack Foods Get a Pandemic Boost
While the COVID-19 pandemic has caused some industries, such as airlines and cruise ships, to see demand evaporate in the short term, The Hershey Company is in a unique position to benefit as consumers eat more snacks, candies, and chocolates to find comfort and compensate for not going out as often.
In 2Q20, The Hershey Company’s retail takeaway (which measures how often consumers purchase the firm’s products relative to a specific market) rose 4% year-over-year (YoY) and rose almost 9% YoY in June alone. While overall volume was down in the quarter, due to international and world travel retail weakness, sales were only down 3.4% YoY in 2Q20. The firm’s ability to withstand the economic downturn provides a level of safety that is hard to find elsewhere.
Superior Distribution Platform Delivers Steady Cash Flows and Superior Market Share
Based on data from Information Resources Inc. (IRi), The Hershey Company owns six of the top 10 confectionary brands, as measured by retail sales in 2018, including Reese’s, Hershey’s, KitKat, Ice Breakers, Hershey Kisses, and Hershey Assortments. The Hershey Company leverages these brands, along with its distribution, product placement, and marketing to maintain a leading market share in each of its target markets, per Figure 1.
In 2019, The Hershey Company is the leading U.S. chocolate firm, with over 44% of the U.S. confection market. Privately owned Mars (M&M, Snickers, and more) is second, with ~30% of the market. Similarly, Hershey holds the number one position in the Mint category, with nearly 37% of the market and ranks number 3 in both gum and non-chocolate (which includes brands such as Twizzlers and Jolly Rancher) with 11% and 8% of those markets.
Figure 1: The Hershey Company’s Leading Market Share

Sources: New Constructs, LLC and IRi via HSY Presentation.
The Hershey Company successfully innovates, through new variations of existing products or updated packaging to improve shelf appeal, to keep consumers buying its products. Per Figure 2, The Hershey Company has grown U.S. Retail takeaway (aka syndicated retail sales data) YoY in each of the last three years and the most recent quarter. Similarly, it has grown its U.S. Candy, Mint, Gum takeaway in two of the past three years and in the last quarter.
The Hershey Company defines takeaway as the rate at which its products are purchased compared to overall sales growth in the expanded multi-outlet plus convenience stores channels. When takeaway is greater than competitors’, the company gains market share. For instance, in 2Q20, the company noted its increased U.S. Candy, Mint, Gum takeaway drove a 227 basis point improvement in market share.
Figure 2: The Hershey Company’s Rising Takeaway

Sources: New Constructs, LLC and company filings.
*U.S. Retail takeaway is measured in the expanded multi-outlet combined plus convenience store channels, which includes candy, mint, gum, salty snacks, meat snacks, and grocery items.
Transforming Into an “Innovative Snacking Powerhouse”
While The Hershey Company holds leading market positions in its core products, it is positioning to take advantage of snacking trends.
In an investor update in March 2017, The Hershey Company noted it wanted to be “an innovative snacking powerhouse.” The firm’s unique position, in that it generates significant cash flow from its existing brands, allows it to deploy capital into new business lines and products, through internal development or acquisition.
Then, the firm can integrate these products into its existing shelf space or negotiate for more shelf space with retailers with whom it already has existing relationships, to put new products on a fast track to success. As the firm’s chief growth officer, Mary Beth West puts it, “Our beloved confection brands will continue to be the engine that drives our business while we broaden our better-for-you portfolio, offering more snacking choices for more consumers.”
Superior Distribution Platform Delivers Future Growth from Better-for-You Snacks
To become a “snacking powerhouse”, The Hershey Company can utilize its existing geographical footprint, place products in desirable locations, and maximize success of new entrants. Since 2017, The Hershey Company has acquired multiple different brands to help grow its portfolio beyond sweets and candy. In early 2018, The Hershey Company acquired Amplify Snack Brands, the parent company of SkinnyPop popcorn, Tyrrells potato chips, Oatmega protein bars, and more. In late 2018, the firm acquired Pirate Brands, the market of Pirate’s Booty cheese puffs. Most recently, The Hershey Company purchased One Brands, the maker of One protein bars.
Expanding into these markets, commonly referred to as “better-for-you” snacks, positions The Hershey Company to appeal to younger consumers that increasingly want healthier options when choosing a snack. Multiple studies have shown that Millennials and Gen Z consumers want healthy and convenient options when snacking. In fact, The Hershey Company’s acquisition of protein bar brands appeals directly to younger consumers’ tastes. According to IRi’s State of the Snack Industry, Millennials are driving 41% of the growth in protein based snacks, such as protein chips, protein bars, and protein packs.
Furthermore, Grand View Research projects the healthy snacks market to grow by 5.2% compounded annually through 2025, which is above the expected growth rate of the candy and gum markets.
While better-for-you snacks made up just 6% of sales in 2019, The Hershey Company aims to grow this segment to 20% of sales in the future. The firm isn’t just focused on growing the top line either. The Hershey Company’s economic earnings have grown from $829 million in 2017 to $1.3 billion TTM. In other words, The Hershey Company isn’t just expanding its product portfolio to drive future growth, it’s doing so while creating shareholder value.
Secular Growth Tailwind
Through its traditional brands, and its recent acquisitions, The Hershey Company is well-positioned to benefit from growing interest in snacking.
Based on data from IRi’s The State of the Snack Industry 2019, consumers are snacking more often. 47% of consumers eat three or more snacks per day, which is up four percentage points from 2015 and significantly higher than 2010, Per Figure 3. The growth in snacking is happening across the industry, not just in a few specific categories either. Last year, chocolate and non-chocolate dollar sales (two of The Hershey Company’s main segments) grew 1% and 3% over the prior year.
Figure 3: Snacking Frequency: 2010 to 2019
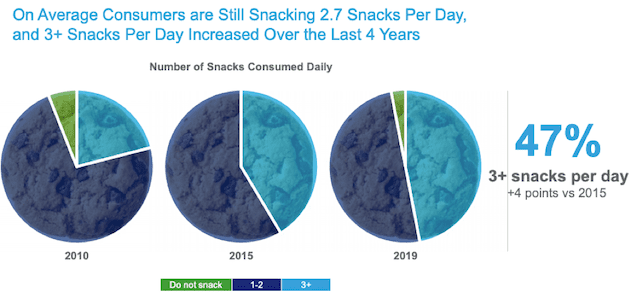
Sources: IRi’s The State of the Snack Industry 2019.
The global candy industry is expected to grow nearly 4% compounded annually through 2024. When we narrow in on some of The Hershey Company’s specific target markets, the projected growth rates are even higher, which provides The Hershey Company with ample opportunity for additional profit growth.
- Grand View Research projects the global chocolate market to grow 4.6% compounded annually through 2027.
- Mordor Intelligence projects the global chewing gum market to grow 4.3% compounded annually through 2024
Lastly, we believe an economic recovery is likely over the long term as the International Monetary Fund (IMF) and nearly every economist in the world believe the global economy will grow strongly in 2021. The IMF estimates the global economy will expand by 5.4%, and the U.S. economy by 4.5%, in 2021. Fitch Ratings projects U.S. GDP growth of 4% in 2021. An overall recovery in the economy should further bolster consumer packaged goods sales.
The Hershey Company’s Long History of Profit Growth
We’re confident in The Hershey Company’s ability to maintain its leading share of the confection market while growing its better-for-you business – largely given the firm’s proven track record of profit growth. Over the past decade, The Hershey Company has grown revenue by 4% compounded annually and core earnings[1] by 9% compounded annually, per Figure 4. Core earnings provide a better measure of profitability and truer insights into valuation than similar measures of profits from legacy data providers.
Longer term, The Hershey Company has grown core earnings by 7% compounded annually over the past two decades. The firm increased its core earnings margin year-over-year (YoY) in eight of the past ten years and from 9% in 2009 to 15% in the trailing-twelve-month period (TTM).
Figure 4: Core Earnings & Revenue Growth Over the Past Decade
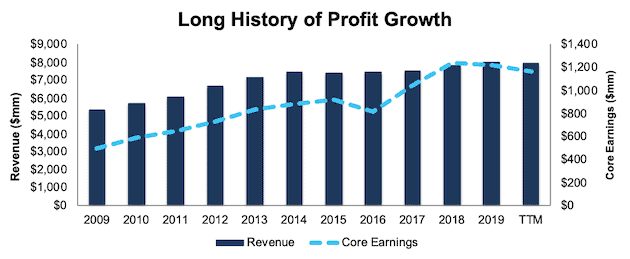
Sources: New Constructs, LLC and company filings.
The Hershey Company’s rising profitability helps the business generate positive free cash flow (FCF) in eight of the past ten years and a cumulative $2.6 billion (9% of market cap) over the past five years. The Hershey Company’s $1.3 billion in FCF over the TTM period equates to a 4% FCF yield.
Profitability Ranks Well Above Peers
The Hershey Company’s profitability is higher and improving faster than its competitors. This improved profitability is a testament to the firm’s focus on improving distribution efficiency, supply chain scale, digital commerce, and improved media and marketing analytics. With improving profitability and a strong balance sheet, The Hershey Company can not only survive the downturn, but is well-positioned to take market share from weaker food product firms as the economy recovers.
Per Figure 5, The Hershey Company’s net operating profit after-tax (NOPAT) margin has improved from 14% in 2015 to 21% TTM. Over the same time, the market-cap-weighted average of 23 other Packaged Foods firms remained stagnant ~11%. This peer group includes firms such as the Kraft Heinz Co. (KHC), Mondelez International (MDLZ), Kellogg Company (K), General Mills (GIS), Hostess Brands (TWNK) and more.
Figure 5: NOPAT Margin Vs. Peers
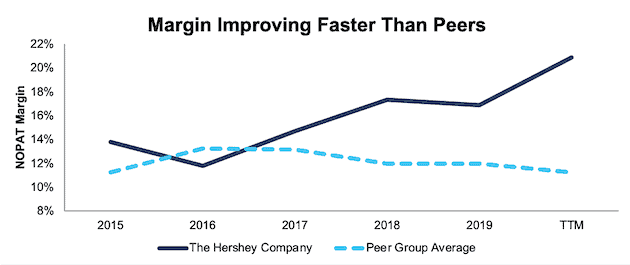
Sources: New Constructs, LLC and company filings.
The Hershey Company’s invested capital turns, a measure of balance sheet efficiency, have actually fallen from 1.4 in 2015 to 1.0 over the TTM. Despite the decline, The Hershey Company’s invested capital turns remain well above the peer group’s market-cap-weighted average invested capital turns of 0.6.
Figure 6: Invested Capital Turns vs. Peers
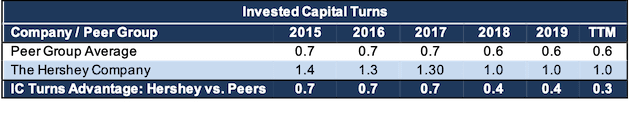
Sources: New Constructs, LLC and company filings.
The firm’s rising margins are enough to offset falling invested capital turns and drive The Hershey Company’s return on invested capital (ROIC) higher. Per Figure 7, The Hershey Company’s ROIC has improved from 16% in 2016 to 20% TTM while the market-cap-weighted average ROIC of peers has fallen from 7% to 6% over the same time.
Figure 7: ROIC vs. Peers
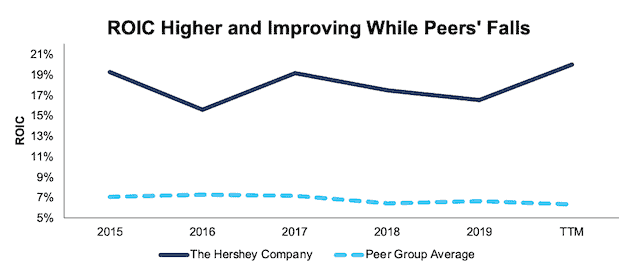
Sources: New Constructs, LLC and company filings.
HSY Trades Below Its Economic Book Value
Despite rebounding from its March lows, at $142/share, HSY trades below its economic book value, or no-growth value, for the first time since 2015. At a price-to-economic book value (PEBV) ratio of 0.8, the cheapest since 2012, the market expects The Hershey Company’s NOPAT to permanently decline by 20%. This expectation seems overly pessimistic over the long term. For reference, The Hershey Company has grown NOPAT by 8% compounded annually over the past decade and 7% compounded annually over the past two decades.
The Hershey Company’s current adjusted economic book value[2] is $158/share – an 11% upside to the current price.
Figure 8: Stock Price vs. Economic Book Value (EBV) using 10-Year Average WACC
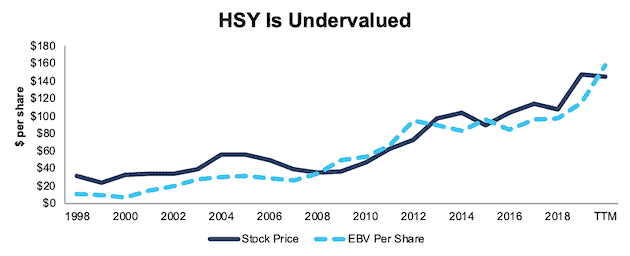
Sources: New Constructs, LLC and company filings.
The Hershey Company’s Current Price Implies a Historical Drop in Profits
Below, we use our reverse DCF model to quantify the cash flow expectations baked into The Hershey Company’s current stock price. Then, we analyze the implied value of the stock based on different assumptions about COVID-19’s impact on consumer spending and The Hershey Company’s future growth in cash flows.
Scenario 1: Using consensus estimates and historical margins, we can model the worst-case scenario already implied by The Hershey Company’s current stock price. In this scenario, we assume:
- NOPAT margin falls to 11% (average from 2007-2009,) in 2020, and increases to 15% (five-year average, compared to 21% TTM) in 2021 and each year thereafter
- Revenue falls 5% (well below consensus estimates for -0.5% revenue decline) in 2020 and does not grow until 2023
- Sales begin growing again in 2023, but only at 3% a year, which is below the average global GDP growth rate since 1961 (3.5%)
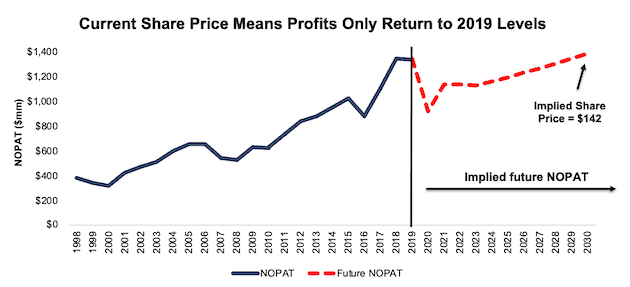
In this scenario, where The Hershey Company’s NOPAT grows less than 1% compounded annually over the next 11 years (including a 38% YoY drop in 2020), the stock is worth $142/share today – equal to the current stock price. See the math behind this reverse DCF scenario.
Figure 9 compares the firm’s implied future NOPAT in this scenario to its historical NOPAT. This worst-case scenario implies The Hershey Company’s NOPAT 11 years from now will be just 3% greater than its 2019 NOPAT. For reference, The Hershey Company’s NOPAT fell 16% YoY in 2007, or less than half the profit drop implied by its current stock price. Additionally, the firm’s 2019 NOPAT was 155% greater than where it stood 11 years prior and The Hershey Company has grown NOPAT by 9% compounded annually since profits bottomed in 2008 during the Great Recession. In any scenario better than this one, HSY holds significant upside potential, as we’ll show.
Figure 9: Current Valuation Implies Severe Drop and Minimal Long-Term Growth in Profits: Scenario 1
Sources: New Constructs, LLC and company filings.
Scenario 2: Moderate Long-Term Recovery Could Be Very Profitable
If we assume, as does the IMF and nearly every economist in the world, that the global economy rebounds and returns to growth starting in 2021, HSY is undervalued.
In this scenario, we assume:
- NOPAT margin falls to 15% (five-year average) in 2020 and rise to 18% (below TTM of 21%) in 2025 and each year thereafter
- Revenue falls 0.5% in 2020, grows 2.9% in 2021 and 2% in 2022 (consensus estimates)
- Revenue grows by 3% a year in 2023 and each year thereafter, which is slightly below the average global GDP growth rate since 1961
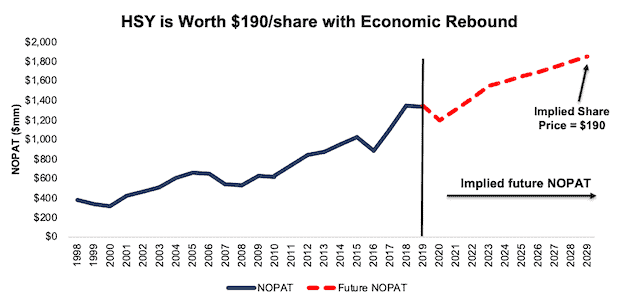
In this scenario, The Hershey Company’s NOPAT only grows by 3% compounded annually over the next decade (including a 12% YoY drop in 2020) and the stock is worth $190/share today – a 34% upside to the current price. See the math behind this reverse DCF scenario.
For comparison, The Hershey Company grew NOPAT by 8% compounded annually over the past decade and 7% compounded annually over the past two decades. It’s not often investors get the opportunity to buy a strong firm in a growing industry at such a discounted price.
Figure 10 compares the firm’s implied future NOPAT in this scenario to its historical NOPAT.
Figure 10: Implied Profits Assuming Moderate Recovery: Scenario 2
Sources: New Constructs, LLC and company filings.
Sustainable Competitive Advantages Will Drive Shareholder Value Creation
Here’s a summary of why we think the moat around The Hershey Company’s business will enable it to continue to generate higher NOPAT than the current market valuation implies. The following competitive advantages help The Hershey Company maintain market share and return to growth as the economy grows again:
- Significant distribution, marketing, and retail footprint to sell and promote new and existing products
- Strong cash flows from leading brands
- Greater margins and ROIC than its peers
What Noise Traders Miss with The Hershey Company
These days, fewer investors focus on finding quality capital allocators with shareholder friendly corporate governance. Instead, due to the proliferation of noise traders, the focus is on short-term technical trading trends while high-quality fundamental research is overlooked. Here’s a quick summary of what noise traders are missing:
- Leading market share in chocolate, mint, gum, and non-chocolate markets
- Strong core earnings growth over the past two decades
- Growing demand for snack foods, chocolate, and candy
- Valuation implies the profits permanently decline by 20%
Dividends and Repurchases Provide Over 3% Yield
Firms with cash flows greater than dividend payments have a higher likelihood to maintain and grow dividends.
The Hershey Company has increased its dividend in each of the past 11 years. Excluding 2018 (in which FCF was -$759 million after the acquisitions of Amplify Snack Brands and Pirate Brands) the firm generated more in in free cash flow $3.3 billion) than it paid out in dividends ($2.1 billion), or an average $301 million surplus each year. Its last quarterly dividend, when annualized, equals $3.22/share and provides a 2.2% yield.
Historically, The Hershey Company has also returned capital to shareholders through share repurchases. The firm repurchased $2.3 billion (8% of current market cap) over the past five years. At the end of 2Q20, the firm had $260 million remaining for future repurchases under its current authorization. Were The Hershey Company to repurchase this entire authorization, it would provide an additional yield of 0.9%, which, when combined with the dividend provide a total yield of 3.1%.
A Consensus Beat or Signs of Recovery Could Send Shares Higher
According to Zacks, consensus estimates at the end of January pegged The Hershey Company’s 2020 EPS at $6.16/share. Jump forward to August 6 and consensus estimates for The Hershey Company’s 2020 EPS have fallen to $6.03/share, despite the resilience shown by the company through the first half of 2020. 2021 estimates follow a similar trend. At the end of January, 2021 EPS consensus was $6.49/share and has since fallen to $6.35/share.
These lower expectations set the firm up to beat consensus, if not this quarter, then maybe the next. Our current Earnings Distortion Score, which is a short-term indicator of the likelihood to beat or miss expectations, for The Hershey Company is “Beat”. The lowered expectations moving forward make it much easier for the firm to beat earnings as well. The firm met or beat EPS estimates in eight of the past 12 quarters, and doing so again, in the midst of such market turmoil, could send shares higher.
Additionally, any signs of a recovery in the global economy could drive The Hershey Company higher. Common locations for its products, such as gas stations, travel centers, and airports are experiencing unprecedented reductions in demand. Any return to more normal levels of traffic/travel, as states and countries get a better handle on COVID-19, provides greater opportunity for The Hersey Company to expand its business and continue its long-term profit growth.
Executive Compensation Could Be Improved but Raises No Red Flags
No matter the macro environment, investors should look for companies with executive compensation plans that directly align executives’ interests with shareholders’ interests. Quality corporate governance holds executives accountable to shareholders by incentivizing them to allocate capital prudently.
The Hershey Company’s executives receive both annual incentives and long-term equity awards. The annual incentives are tied to net sales, adjusted earnings per share, and EBIT margin goals.
Long-term equity awards, and specifically the performance share portion (65% of equity awards), are tied to relative total shareholder return, three-year CAGR in adjusted earnings per share, and three-year cumulative free cash flow.
We would prefer the firm use ROIC improvement when determining executive compensation, as there is a strong correlation between improving ROIC and increasing shareholder value. Having accurate values for NOPAT and invested capital ensures investors have an apples-to-apples metric for measuring corporate performance and holds management accountable for every dollar invested into the company.
Despite not using ROIC when measuring performance, The Hershey Company’s compensation plan has not compensated executives while destroying shareholder value. The Hershey Company has grown economic earnings by 8% compounded annually over the past decade.
Insider Trading and Short Interest Trends
Over the past 12 months, insiders have bought 88 thousand shares and sold 150 thousand shares for a net effect of 62 thousand shares sold. These sales represent less than 1% of shares outstanding.
There are currently 2.7 million shares sold short, which equates to 1% of shares outstanding and two days to cover. Short interest is down 4% from the prior month, and remains minimal.
Critical Details Found in Financial Filings by Our Robo-Analyst Technology
As investors focus more on fundamental research, research automation technology is needed to analyze all the critical financial details in financial filings as shown in the Harvard Business School and MIT Sloan paper,"Core Earnings: New Data and Evidence”.
Below are specifics on the adjustments we make based on Robo-Analyst findings in The Hershey Company’s filings:
Income Statement: we made $494 million of adjustments, with a net effect of removing $198 million in non-operating expenses (2% of revenue). You can see all the adjustments made to The Hershey Company’s income statement here.
Balance Sheet: we made $3.2 billion of adjustments to calculate invested capital with a net increase of $1.9 billion. One of the largest adjustments was $1.2 billion in asset write-downs. This adjustment represented 19% of reported net assets. You can see all the adjustments made to The Hershey Company’s balance sheet here.
Valuation: we made $7 billion of adjustments with a net effect of decreasing shareholder value by $5 billion. Apart from total debt, the largest adjustment to shareholder value was $1 billion in excess cash. This adjustment represents 3% of The Hershey Company’s market cap. See all adjustments to The Hershey Company’s valuation here.
Attractive Funds That Hold HSY
The following funds receive our Attractive-or-better rating and allocate significantly to The Hershey Company:
- Invesco Dynamic Food & Beverage ETF (PBJ) – 4.7% allocation and Attractive rating
- AdvisorShares Focused Equity ETF (CWS) – 3.9% allocation and Attractive rating
- Bright Rock Mid Cap Growth Fund (BQMGX) – 3.5% allocation and Attractive rating
- Invesco S&P 500 Equal Weight Consumer Staples ETF (RHS) – 3.0% allocation and Very Attractive rating
- Mundoval Fund (MUNDX) – 3.0% allocation and Attractive rating
[1] Our core earnings are a superior measure of profits, as demonstrated in Core Earnings: New Data & Evidence a paper by professors at Harvard Business School (HBS) & MIT Sloan. The paper empirically shows that our data is superior to “Operating Income After Depreciation” and “Income Before Special Items” from Compustat, owned by S&P Global (SPGI).
[2] We utilized the override capability in our Company Valuation Model to calculate HSY’s TTM EBV using the firm’s 10-year average weighted average cost of capital (WACC) to derive an EBV that is less sensitive to any changes in WACC. This approach is especially useful in the current low interest rate environment. While we do not know where interest rates will go in the future, calculating EBV with longer-term average WACC gives a more conservative EBV in the event interest rates increase in the future.
Disclosure: David Trainer, Kyle Guske II, and Matt Shuler receive no compensation to write about any specific stock, style, or theme.


