
(Click on image to enlarge)
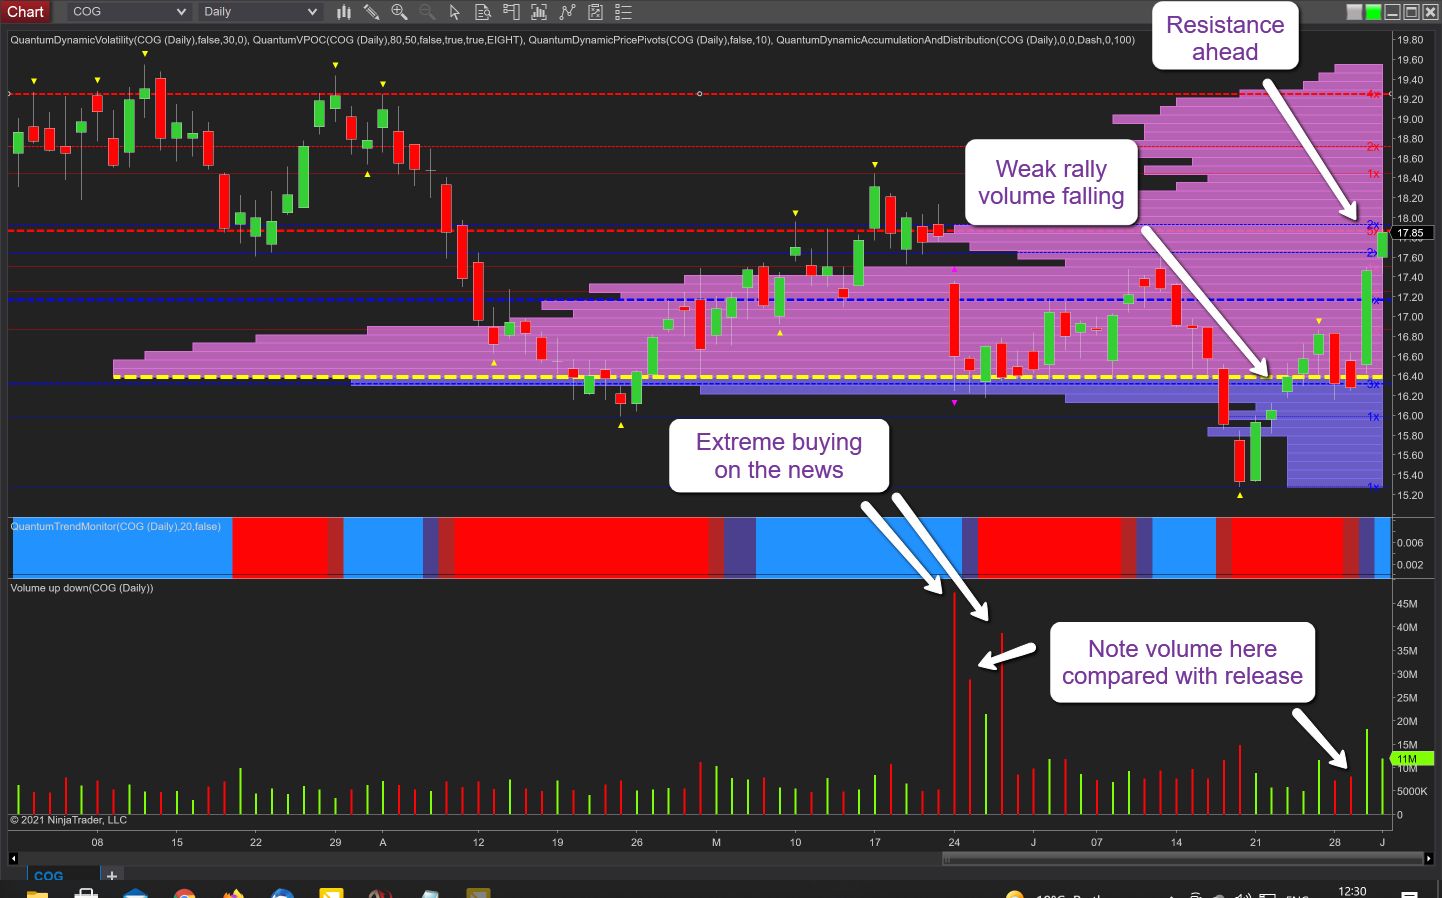
Regular readers of my analysis will no doubt recall my post of the 25th May this year in which I highlighted one stock to consider adding to a watchlist and this was Cabot Oil & Gas (COG). And the reason for this was the announcement of the agreed merger with Climarex Energy on an all-stock merger of equals. Whilst this has yet to be approved by shareholders what was clear from the associated volume on the daily chart was that it was also an opportunity for the market makers to step in and buy, and buy big and once the heavy selling has been absorbed, to prepare for a new campaign to take the stock higher on a longer bullish trend. So what I suggested at the time was that patience would be required and wait for the accumulation phase to develop before considering any longer-term opportunities. In other words, wait until the move higher develops, and as we can see from the chart this is was is beginning to take place with the stock price closing yesterday at $17.85 and testing the resistance cluster on the accumulation and distribution indicator shown in red and blue.
If we walk through the chart from the 24th of May with the extreme volume and the volatility candle, note how the volume on the down candles falls away over time. We have the initial extreme volume over four days, with the price action then settling around the volume point of control. The rally back to the VPOC denoted with the yellow dashed line of last month is on falling volume, so no surprise to see this move run out of energy. However, note the selling volume which follows, and more importantly, it is in the same region as the extreme volume of the 24th and 24th May. In this case, the volume is low and confirms the selling pressure has been absorbed and is followed by two up days on good volume. Now we have to wait for the price to break above the $18 price point, and if so, we should see the stock move on through the low volume area on the VPOC histogram and towards the top of the chart towards the $20 level.


Comments
Log in or sign up to join the conversation.