
China And Technical Picture Combine To Weaken Apple
(Click on image to enlarge)
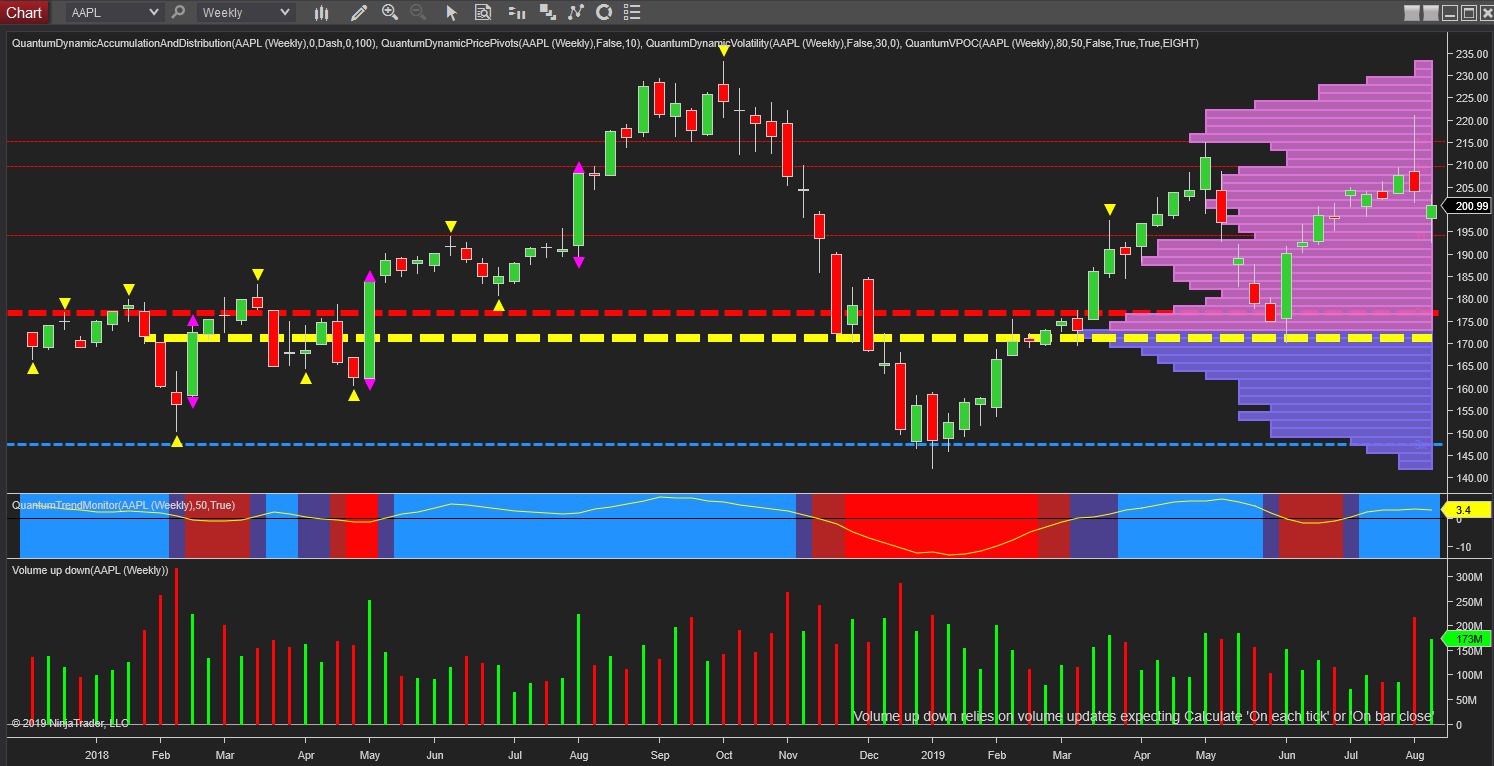
Apple (AAPL) is another of our regular stocks and one I suggested was looking weak ahead of the recent earnings as it approached the $210 per share region and into a strong area of resistance.
In addition, this stock is extremely sensitive to the ongoing tariff war with China and whilst the share price spiked on the release, it has since collapsed to trade at $200.99 at the close of last week’s trading session. This has resulted in a significant technical signal on the weekly chart from a volume price analysis perspective. And two things are clear. First, the candle of two weeks ago signalled this weakness and second, this was confirmed by the volume spike as the market makers sold heavily into the gapped move higher.
The price action alone was sufficient to confirm the selling on the week with the very deep upper wick, with volume confirming this was a genuine move and one which is likely to see the stock continue to wallow at this level with the prospect of returning to the volume point of control which remains firmly anchored in the $172 per share region. Moreover, the ongoing tariff war between the US and China can only add further downward pressure to a stock labouring higher.
Disclaimer: Futures, stocks, and spot currency trading have large potential rewards, but also large potential risk. You must be aware of the risks and be willing to accept them in order to invest in ...
more

