
Checking In On The Semiconductor Complex
A few weekly charts (the index, the primary chip maker, an equipment company and a materials company) to gauge the progress of this sector that was so hard to get bullish on a few months ago and now, maybe too easy to be bullish on for momos, speed freaks and various other casino patrons.
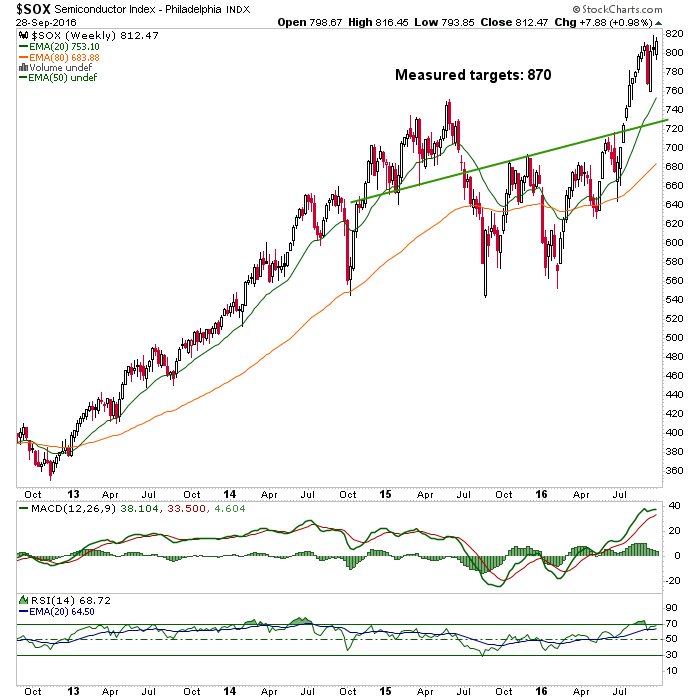
The Semiconductor Index (SOX) measures to 870 on its weekly pattern. We have monthly charts targeting the low/mid 900’s. Why is it going there? How do I know? It’s just a chart. Maybe it’s wrong; but then again, the charts have been very not wrong thus far. I would like to see a test of the EMA 20 first, however, because this thing is as far above the EMA 20 as it gets and is overbought.
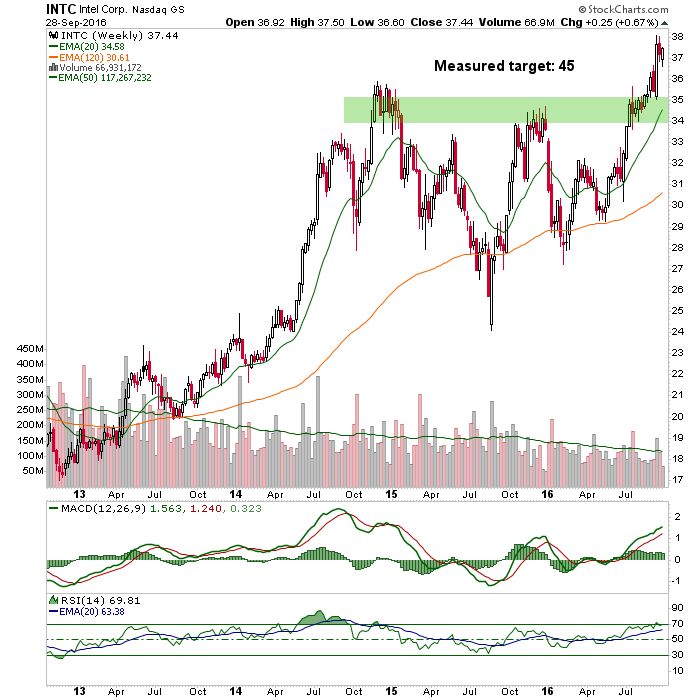
Massive dinosaur chip maker Intel (INTC) targets 45 by this chart but has not yet even registered the 40 target NFTRH+ assigned it a couple years ago, based on a long-term (decade+) breakout. Key support is noted.
Equipment maker Lam Research (LRCX) was identified by NFTRH+ as it was flirting with the breakout. Should the market continue to correct near-term as expected, watch the EMA 20 and the massive lateral cluster as key support. The target is the target, meanwhile.

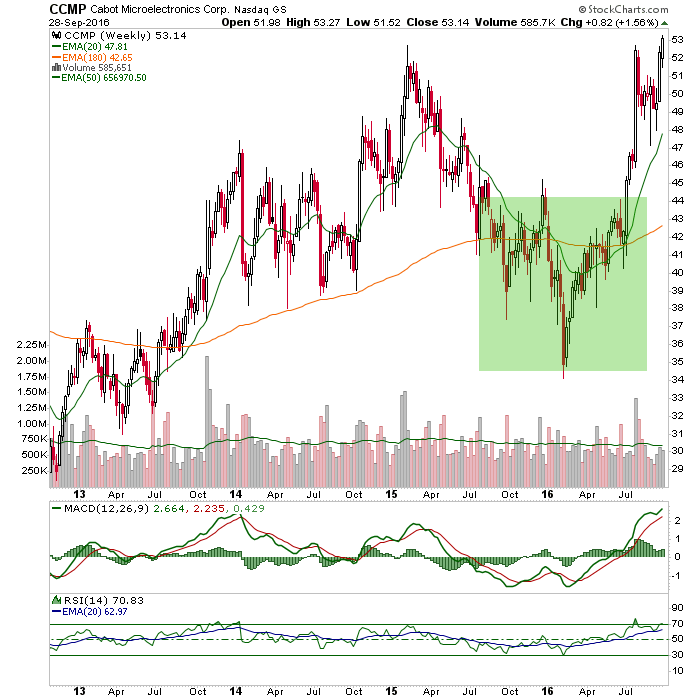
Cabot Micro (CCMP) was added for its status as a key polishing materials provider and its sexy pattern back when nobody liked it. Today, too many people like it and it is as high above the EMA 20 as it gets. Overbought.
Disclosure: Subscribe to more


