
Chart Wars: What To Watch As Meta Platforms (Facebook), Twitter Rebound With Tech Sector

Meta Platforms, Inc FB and Twitter, Inc TWTR stock gained ground Friday in tandem with the S&P 500, which was trading over 0.6% higher.
Tech stocks have seen a sharp rebound over recent trading sessions, with the Nasdaq soaring over 10% since Monday despite geopolitical risks brought on by Russia’s invasion of Ukraine.
Although the start of the war accelerated the decline initially, the steep sell-off during the first quarter of 2022 may have been due to the market pricing in the interest rate hikes announced Wednesday by the Federal Reserve.
The Fed guided to a 0.25% to 0.5% raise and five more rate hikes planned for later this year. The subsequent rise could be could be an indication that traders and investors’ fears over the rate hikes have subsided, or the rebound could merely be an oversold bounce to cool off technical indicators.
Which of the two scenarios is in play may take some time to be known, but Meta and Twitter have begun to show signs they may begin trading in an uptrend, with both stocks likely to present an entry for bullish traders over the coming days.
It should be noted that events affecting the general markets, negative or positive reactions to earnings prints and news headlines can quickly invalidate patterns and breakouts. As the saying goes, "the trend is your friend until it isn't," and any trader in a position should have a clear stop set in place and manage their risk versus reward.
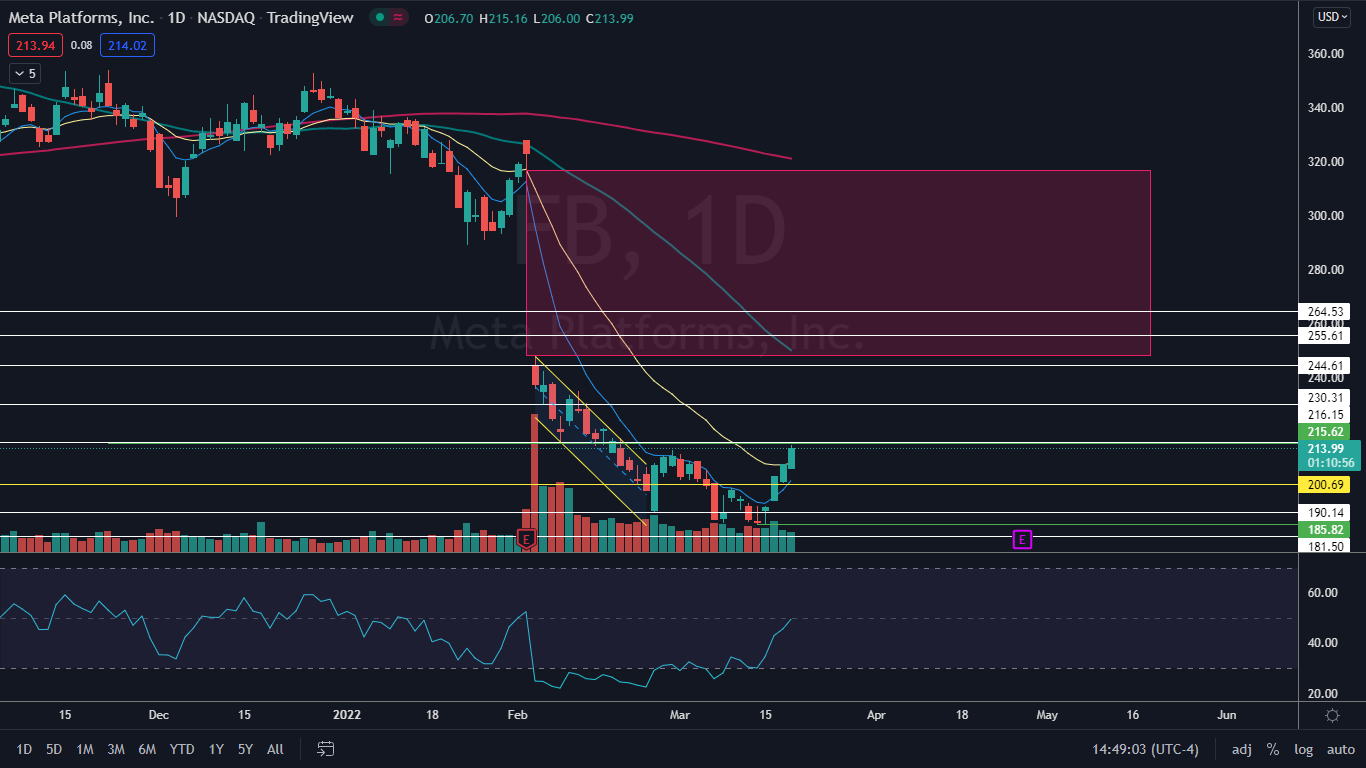
The Meta Chart: On March 14 and March 15, Meta printed a bullish double bottom pattern at the $185.82 level, and on March 16 the stock reacted to the pattern by printing a bullish kicker candlestick, which indicated higher prices were ahead.
- Although Meta printed a higher high above the March 9 lower high of $199.10, the stock has not yet printed a higher low to confirm an uptrend is in the works. If the stock falls lower over the coming days, bearish traders could choose to take a position if a reversal candlestick, such as a doji or hammer candlestick, forms above the $185 level for a solid entry point.
- Meta has a massive gap above between $248 and $316.87, which has about a 90% chance of being filled in the future. If the stock rises to completely fill the gap, it will represent a 48% increase from the current share price.
- Meta has resistance above at $216.15 and $230.31 and support below at $200.69 and $190.14.
(Click on image to enlarge)
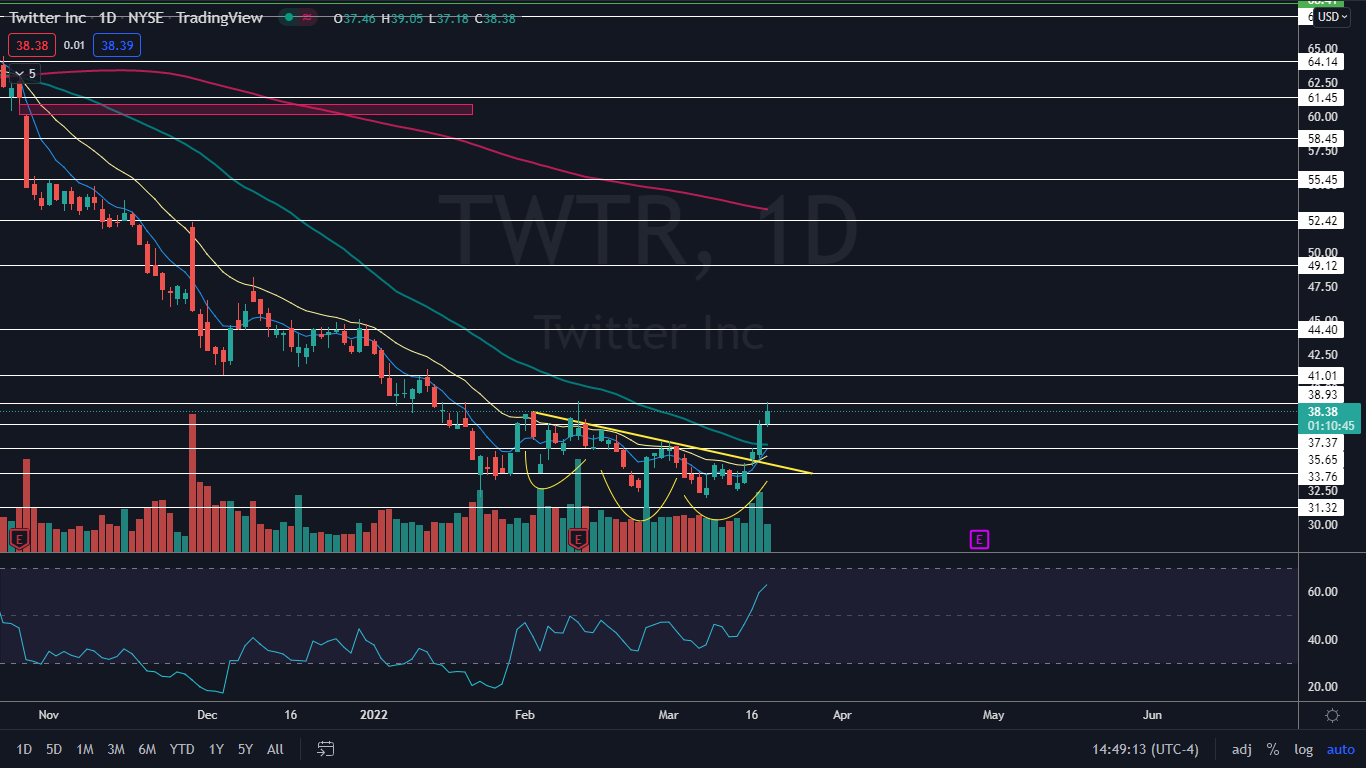
The Twitter Chart: On March 16, Twitter broke up bullishly from the neckline of an inverted head-and-shoulders pattern on higher-than-average volume, which indicated the pattern had been recognized.
On Thursday, the stock had another day of higher-than-average volume and printed a bullish Marubozu candlestick, which indicated higher prices were likely to come again on Friday.
- Like Meta, Twitter has printed a higher high but not a higher low to confirm an upward trend change. When the stock dips to print the higher low, bullish traders may choose to take a position when the pattern is confirmed.
- On Thursday, Twitter’s eight-day exponential moving average crossed (EMA) above the 21-day EMA, which should give bulls more confidence going forward. The stock’s relative strength index is running high at about 64%, indicating the higher low may come on Monday or Tuesday.
- Twitter has resistance above at $38.93 and $41.01 and support below at $37.37 and $35.65.
(Click on image to enlarge)
© 2022 Benzinga.com. Benzinga does not provide investment advice. All rights reserved.


