
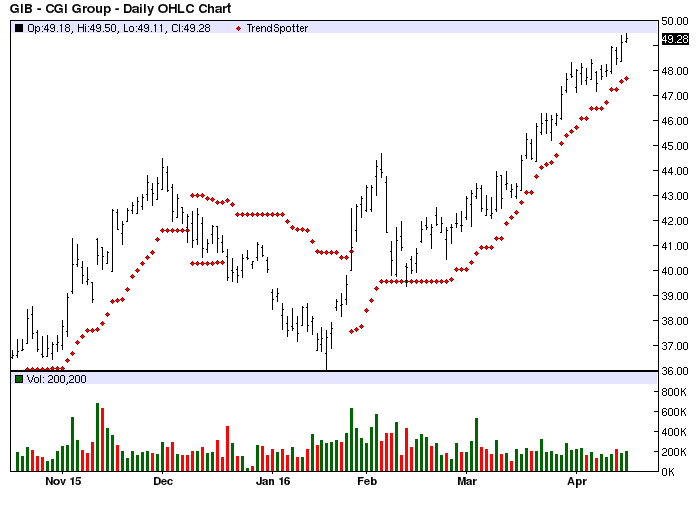
CGI Group - Chart Of The Day
The Chart of the Day belongs to CGI Group (NYSE:GIB). I found the computer consulting stock by using Barchart to sort the All Time High list first for the most frequent number of new highs in the last month, then again for technical buy signals above 80%. Next I used the Flipchart feature to review the charts. Since the Trend Spotter signaled a buy on 1/27 the stock gained 20.04%.
CGI provides the full range of IT services including consulting, systems integration and the management of business and IT functions. The company's primary focus is large scale systems integration and outsourcing contracts.
(click to enlarge)
The status of Barchart's Opinion trading systems are listed below. Please note that the Barchart Opinion indicators are updated live during the session every 10 minutes and can therefore change during the day as the market fluctuates. The indicator numbers shown below therefore may not match what you see live on the Barchart.com web site when you read this report.
Barchart technical indicators:
- 96% technical buy signals
- Trend Spotter buy signal
- Above its 20, 50 and 100 day moving averages
- 13 new highs and up 13.68% in the last month
- Relative Strength Index 71.79%
- Technical support level at 48.91
- Recently traded at 49.28 with a 50 day moving average of 44.31
Fundamental factors:
- Market Cap $13.72 billion
- P/E 19.18
- Revenue expected to grow 4.60% this year and another 2.70% next year
- Earnings estimated to increase 12.50% this year, an additional 7.10% next year and continue to compound at an annual rate of 8.65% over the next 5 years
- Wall Street analysts issued 12 buy, 4 hold and 1 under perform recommendation on the stock.
Stocks: GIB
Disclosure: None.


