
Central Banks Are Buying $1.4 Billion In Assets Every Hour: 20 Stunning Facts About The "Market"
Once upon a time, there was a market. Unfortunately, over the past decade, and especially since March it has mutated into a centrally-planned "market" political tool where according to the latest Thundering Herd report from BofA's Michael Hartnett, central banks now purchase a ridiculous $1.4 billion in assets every hour (since the all too convenient March COVID lockdowns) just to keep the entire "wealth effect" edifice from crashing down. It also explains why since the March lockdown, the Nasdaq has been rising at a rate of $1.6 billion per hour, almost as if every dollar the Fed inject goes right into tech company market caps.
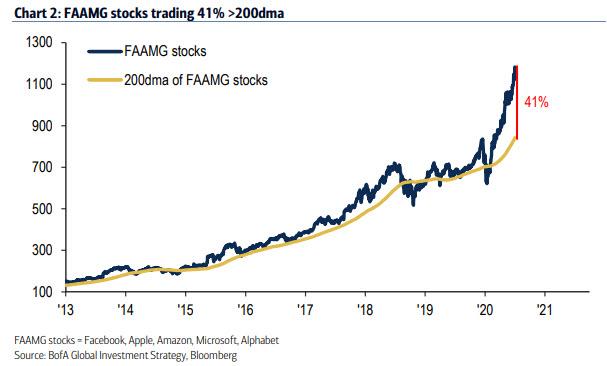
And speaking of the Nasdaq in general, Hartnett writes that FAAMG stocks are now trading 41% above their 200dma (or were until the SoftBank trade blew up), compared to 55% > 200dma in March 2000.
(Click on image to enlarge)
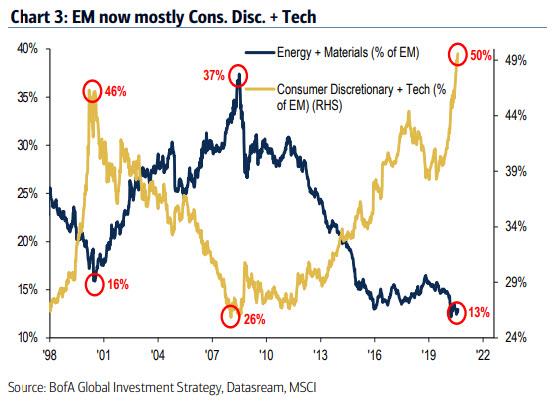
At the same time, EM tech/discretionary now makes up more than half of the EM index...
(Click on image to enlarge)
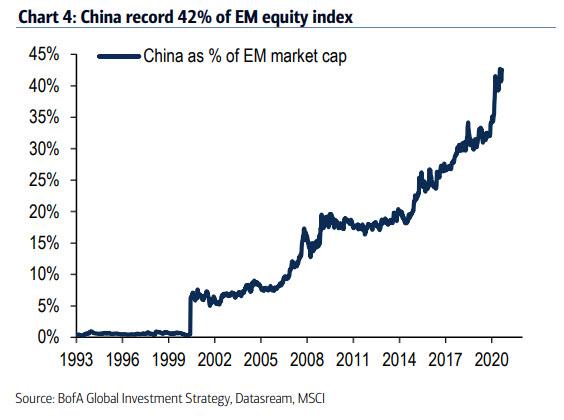
... with China alone comprising 42% of the EM index.
(Click on image to enlarge)
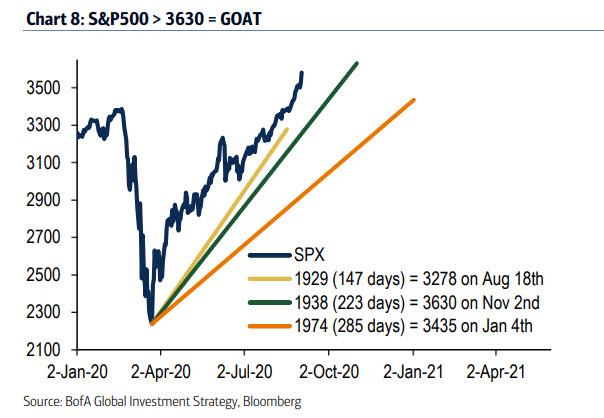
Finally, on the back of gargantuan liquidity injections by central banks, the S&P500 is now approaching 3630, which as we noted last Friday, would make this the Greatest Of All Time rally if the S&P were to hit the bogey ahead of the election, and in the process flipping bears into bulls just as stocks enter unprecedented historical territory.
(Click on image to enlarge)
These are just a handful of the most jarring statistics compiled by the Bank of America Chief Equity Strategist which we repost below.
- $1.41BN: Central bank asset purchases every hour since COVID-19 March lockdowns
- $1.6BN: Nasdaq 100 market cap gain every hour since COVID-19 March lockdowns
- 34 days: Equity bear market in 2020 shortest ever
- $2000: gold best performing asset class in 2020, first year since 2010
- 50%: annualized return from 30-year US Treasury this year
- 100 years: corporate bonds hit 100-year highs versus commodities April 20
- 100 years: US stocks almost at 100-year highs versus US government bonds
- 59%: US equities as share of MSCI global equity index (ACM) at all-time high
- 42%: Chinese equities as share of Emerging Markets at all-time high
- 21%: gain in global stocks (ACWI ex. US) required to match 2007 high
- 25%: market cap of FAANG as % US stocks, of US stocks, record concentration
- $9.3TN: market cap of US tech sector entire > market cap of Europe's stock market
- 24x: trailing PE ratio of S&P500, surpassed only Dec 21 (25x) & Jun 99 (30x)
- 1.7%: dividend yield on 5&P500 now same as 5-year breakeven inflation rate
- 2021: global consensus forecasts for 2021...GDP 5.1%, EP5 29.0%...up big
- 2021: global consensus forecasts for 2021...CPI 1.3%, bond yield 0.5%...unchanged
- $258Tn: size of global debt at record high, 2.3x of global GDP
- $212Tn: value of global bonds & equities, an all-time high, 2.3x global GDP
- $14tn: value of global negatively yielding bonds
- 40%: Bank of Japan owns 40% of JGB market; Fed owns 14% of Treasury market
Disclaimer: Copyright ©2009-2020 ZeroHedge.com/ABC Media, LTD; All Rights Reserved. Zero Hedge is intended for Mature Audiences. Familiarize yourself with our legal and use policies every time ...
more

