
CarGurus: What We See In The Name
CarGurus (CARG) is an interesting name that recently went public. Since the IPO, the stock has had interesting performance:
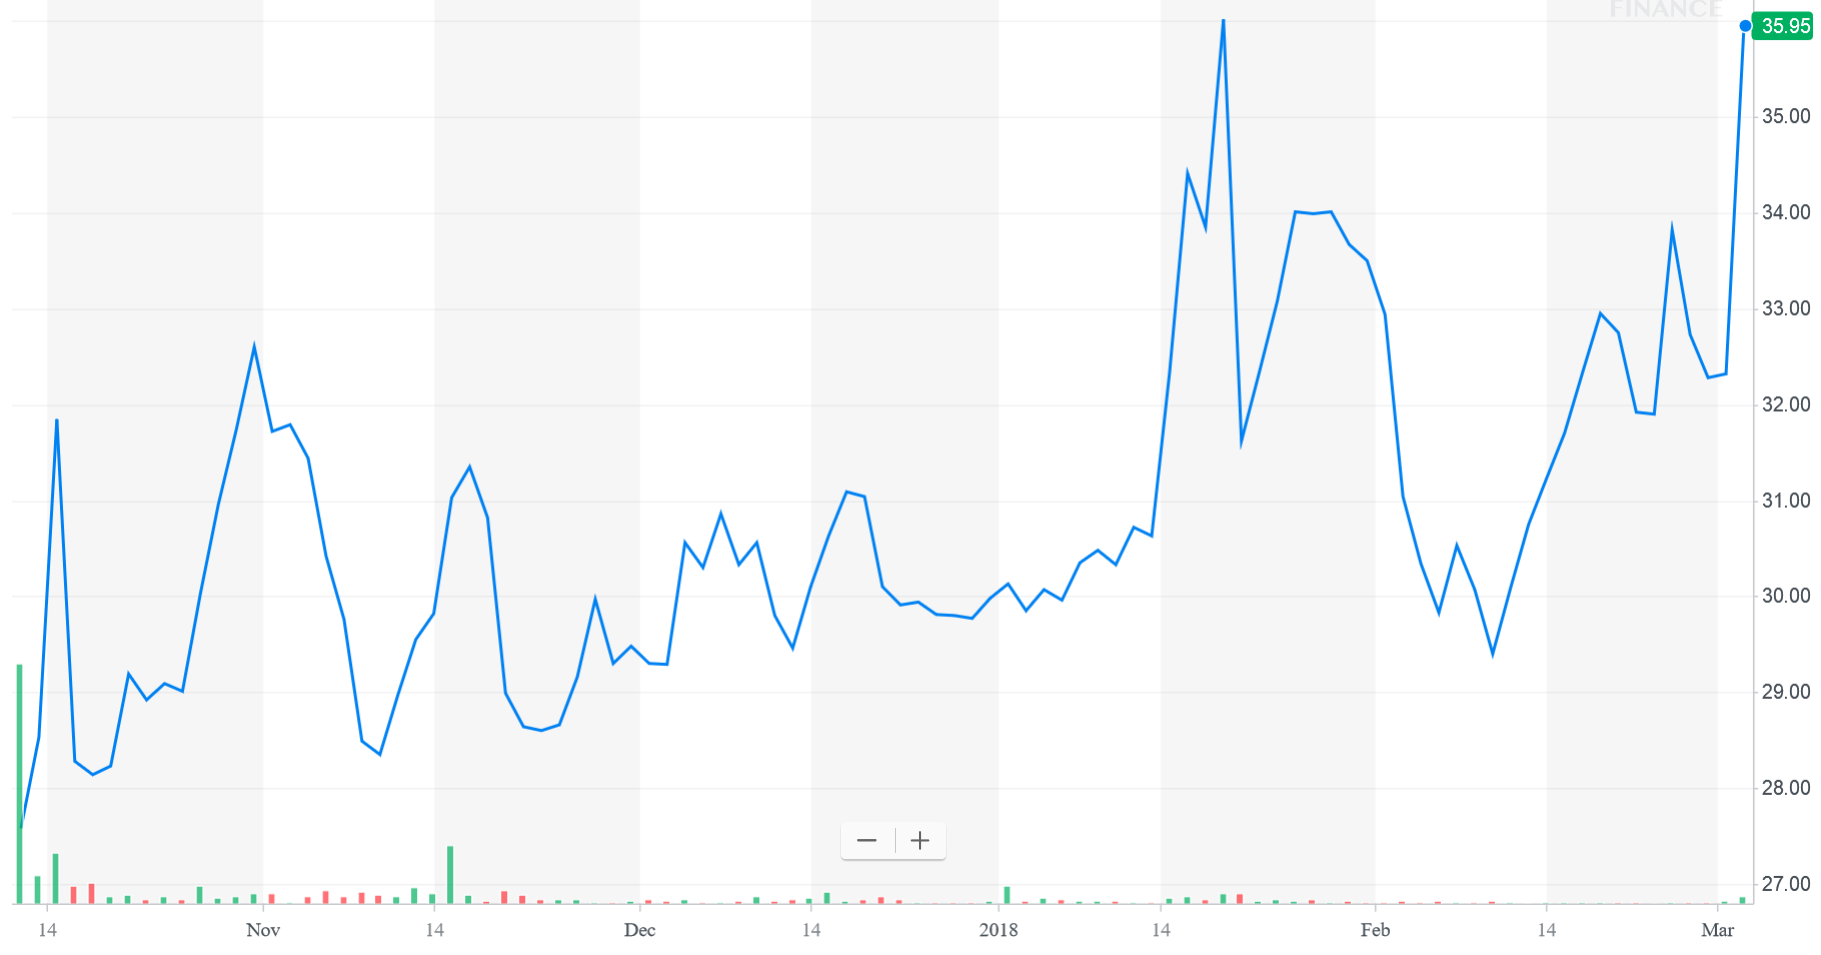
Source: Yahoo Finance
As you can see, the stock has steadily increased since the IPO last fall. We have been bullish on the name since that time, and have closely monitored the performance of the name. In the present column, we check in on the name and assess recent performance. We also offer our projections going forward for 2018.
Revenues remain strong
The top line continues to be strong for CarGurus. Total revenue was $90.6 million, an increase of a whopping 49% compared to $60.8 million in the fourth quarter of 2016. So, what went into these sales? Well, marketplace subscriptions were incredibly strong. Marketplace subscription revenue was $80.8 million, an increase of 52% compared to $53.2 million in the fourth quarter of 2016. This was a huge driver of the top line, and above our expectations for growth of $25 million. Further, advertising revenue was $9.8 million, an increase of 30% compared to $7.6 million in the fourth quarter of 2016, which also surpassed our expectations of $9 million.
For the full year 2017, performance was even stronger on a comparative basis. Total revenue was $316.9 million, an increase of 60% compared to $198.1 million in 2016. What went into these figures? Once again, both subscription and advertising revenue rose. Truly impressive. Marketplace subscription revenue was $282.7 million, an increase of 65% compared to $171.3 million in 2016, while advertising revenue was $34.2 million, an increase of 27% compared to $26.8 million in 2016. The question is whether these growing revenues, which were impressive and we view as bullish, led to growing income, or whether expenses were too high offsetting these gains.
Operating income grows but not as impressive as expected
We were slightly underwhelmed by operating income. As we feared, the cost to generate this impressive revenue shot higher. This less to Q4 GAAP operating income was approximately break-even, or less than 1% of total revenue, compared to $4.6 million or 8% of total revenue in the fourth quarter of 2016. Making adjustments for comparable items, operating income was $4.8 million, or 5% of total revenue, compared to $4.7 million or 8% of total revenue in the fourth quarter of 2016. This was disappointing, though for the year things were a bit better.
For all of 2017, GAAP operating income was $15.3 million, or 5% of total revenue, compared to $8.6 million or 4% of total revenue in 2016. That is a positive, but we were pleased with the full year adjusted results. Adjusted operating income for the year was $20.3 million, or 6% of total revenue, compared to $8.9 million or 4% of total revenue in 2016.
Bottom line
For Q4, GAAP net income attributable to common shareholders was $2.1 million, or $0.02 per share based on 103.2 million weighted average diluted shares outstanding, compared to a net loss attributable to common shareholders of $28.2 million or ($0.66) per share based on 42.6 million weighted average diluted shares outstanding in the fourth quarter of 2016. That is strong. On an adjusted basis, net income was $5.3 million, or $0.05 per share. Further, adjusted EBITDA was $6.0 million, compared to $5.4 million in the fourth quarter of 2016.
For all of 2017, GAAP net income was $13.2 million as compared to net income of $6.5 million in 2016. Adjusted net income was $15.8 million, or $0.15 per share compared to $6.0 million in 2016. Most impressively, Adjusted EBITDA, was $24.1 million, compared to $11.0 million in 2016.
Cash looks good
As of December 31, 2017, CarGurus had cash, cash equivalents, and short-term investments of $137.7 million and no debt. That is right, absolutely no debt. It has a clean balance sheet, The company generated $7.1 million in cash from operations and $5.5 million in free cash flow, during the fourth quarter of 2017. For the full year of 2017, the company generated $25.7 million in cash from operations and $18.3 million in free cash flow.
2018 projections
We remain bullish on the stock as we move forward. Website traffic and consumer engagement metrics for the fourth quarter of 2017 grew markedly and we anticipate this will continue in 2018. We are looking for average monthly unique users to approach 30 million this year. U.S. average monthly unique users were 25.7 million, an increase of 25% compared to 20.6 million in the fourth quarter of 2016. We also see international use doubling. International average monthly unique users were 2.8 million, an increase of 53% compared to 1.8 million in the fourth quarter of 2016.
We expect such momentum to continue, and our revenue and earnings expectations reflect this bullish outlook. Assuming this level of growth, for 2018 we expect 2018 revenue to exceed $400 million, in a range of $400 to $412 million. After making adjustments, we expect earnings per share will grow to $0.16 to $0.18. We remain bullish.
Quad 7 Capital is a leading contributor with various financial outlets. If you like the material and want to see more, scroll to the top of the article and hit "follow." Quad 7 Capital also ...
more

