
Bull Rallies & Market Tops

Last week, we discussed the fulfillment of our expectations for a bull rally. While the rally was attributed to the rather “dovish” stance taken by Jerome Powell and commentary from the White House on potential progress on resolving the “trade war” with China the reality is it had little to do with those headlines but was simply a reversal of the previous “exhaustion extreme” of sellers during November and December. The rally, as we laid out two weeks ago, continues to work within the expected range back to 2650-2700.
Importantly, the previous deep “oversold” condition which was supportive of the rally following Christmas Eve has now been fully reversed back into extreme“overbought” territory. While this doesn’t mean the current rally will immediately reverse, it does suggest that upside from current levels is likely limited.
Nonetheless, the rally from the December lows has been impressive. However, I want to caution investors from extrapolating a deeply oversold bounce into something more than it is.
Beware The Headlines
“The stock market just got off to its best start in 13 years. The 7-session start to the year is the best for the Dow, S&P 500 and Nasdaq since 2006.” – Mark DeCambre via MarketWatch
While headlines like this will certainly get “clicks” and “likes,” it is important to keep things is perspective. Despite the rally over the last several sessions, the markets are still roughly 3% lower than where we started 2018, much less the 11% from previous all-time highs.
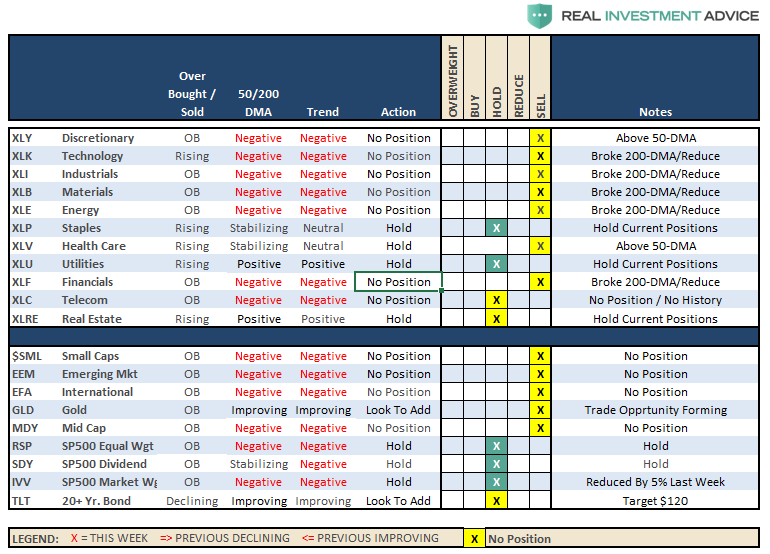
Importantly, there has been a tremendous amount of “technical damage” done to the market in recent months which will take some time to repair. Important trend lines have been broken, major sell-signals are in place, and major moving averages have crossed each other signaling downward pressure for stocks.
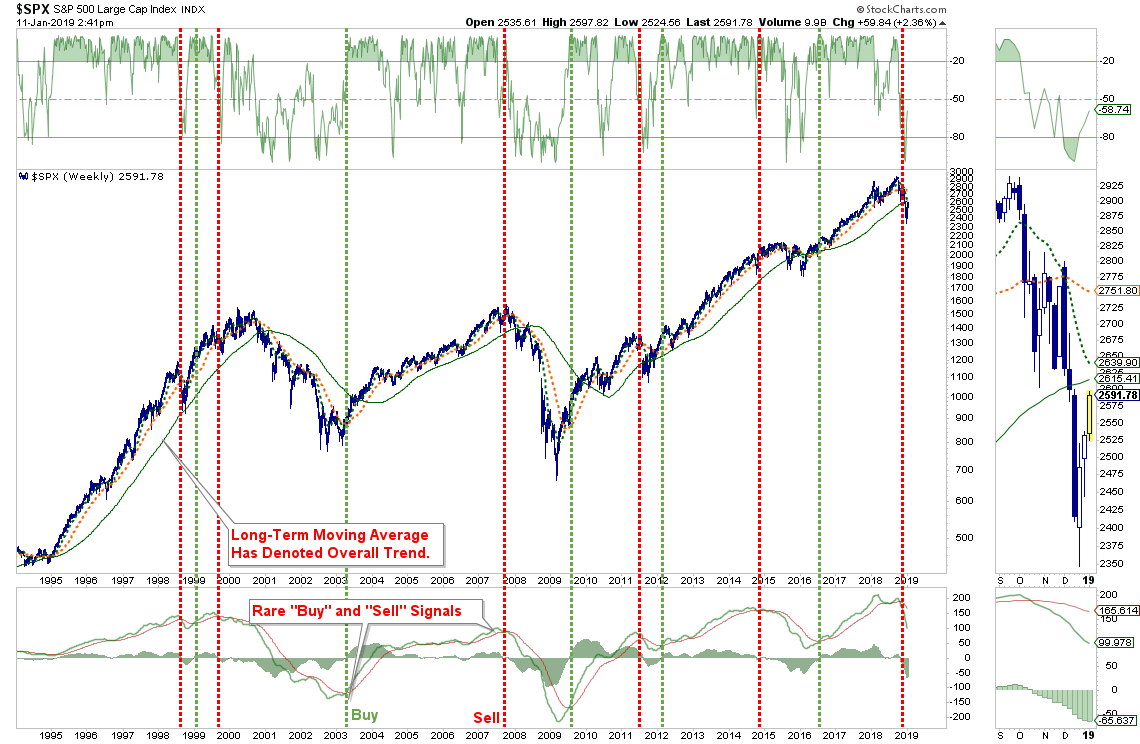
While the chart is a bit noisy, just note the vertical red lines. There have only been a total of 6-periods in the last 25 years where all the criteria for a deeper correction have been met. While the 2011 and 2015 markets did NOT fall into more protracted corrections due to massive interventions by Central Banks, the current decline has no such support currently.
So, while there are many headlines circulating the “interweb” currently suggesting the “Great Bear Market Of 2018” is officially over, I would caution you against getting overly bullish too quickly.
Tops Are A Process
As my friend and colleague Doug Kass wrote previously:
“Tops are a process and bottoms are an event, at least most of the time in the stock market. If you looked at an ice cream cone’s profile, the top is generally rounded and the bottom V-shaped. That is how tops and bottoms often look in the stock market, and I believe that the market is forming such a top now.”
He is correct.
There have been several suggestions as of late that last years slide from October into December was simply a correction. Here is Mark Hulbert’s take:
“The stock market’s recent correction has been more abrupt than you’d expect if the market were in the early stages of a major decline.
I say that because one of the hallmarks of a major market top is that the bear market than ensues is relatively mild at the beginning, only building up a head of steam over several months. Corrections, in contrast, tend to be far sharper and more precipitous.”
However, I disagree.
I think Mark’s mistake is in simply looking at the plunge from the mid-year highs rather than the entire topping process which started in November of 2017.
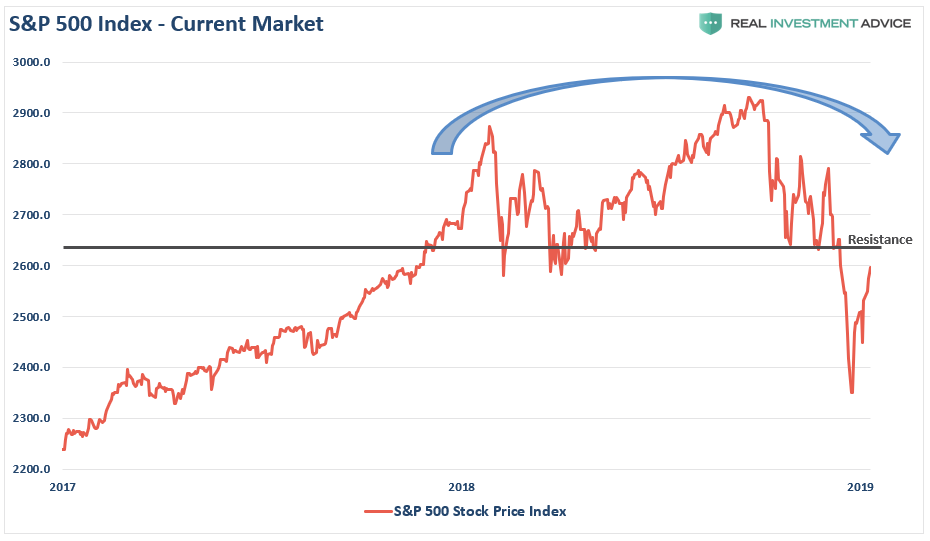
After a record breaking number of positive months in 2017 with extremely low volatility; 2018 was a year where volatility returned as prices consolidated in a very broad range. Notice there was important price support being built by the markets by repeatedly testing price levels over time before giving way.
“So…is the bear market over OR is it just starting?”
The honest answer is “I don’t know.”
But, anything is certainly possible.
However, a look back through history at previous “bear market beginnings” can certainly give us some things to consider.
1974
After two previous bear market declines, as I discussed just recently with respect to “Secular Bear Markets,” the S&P 500 broke out to all-time highs convincing the“bulls” the worst was over.
It wasn’t.
Over the next several months the markets continued in volatile trade,retesting support several times before breaking down.

But, at this point, it was still believed just to be a correction.
The change occurred when the market rallied, and failed, at the previously broken support line.
That “failure point” marked the beginning of the “1974 Bear Market.”
1999
After the “Long-Term Capital Management” and the “Asian Contagion,” the market regained its footing and began a rampant run to all-time highs in 1999. The bulls were clearly in charge, and despite concerns of “Y2K,” stocks continued to press new highs.
While Jim Cramer was busy publishing his list of the “Top 10 Stocks For The Next Decade,” the market begin to struggle to make new highs as volatility rose.
The early decline from “all-time highs” was only considered a correction as the demand by the bulls to “buy the dip” rang out loudly.
“I think you’ll see healthier and broader advances in the market. Now is the time for optimism,” said Bill Meehan, chief market analyst with Cantor Fitzgerald (4/14/2000)
It wasn’t.
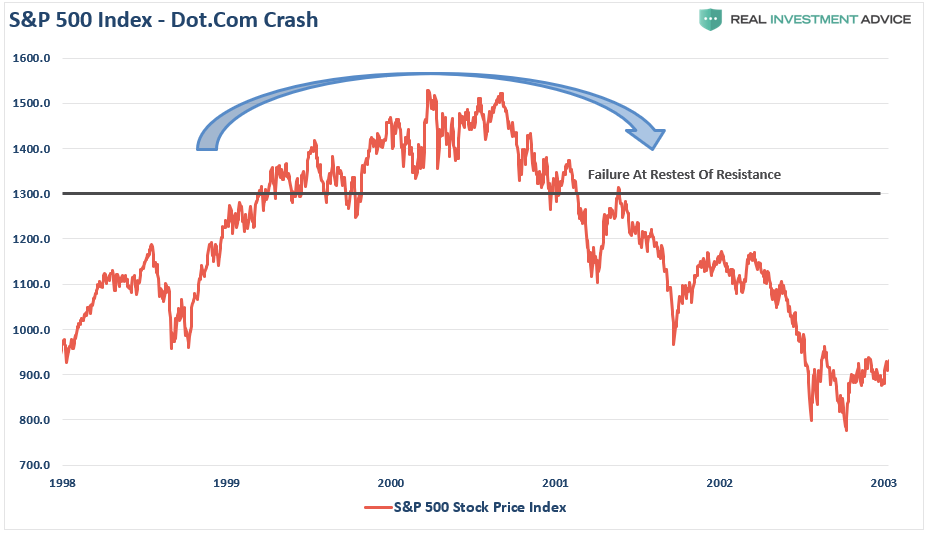
In early 2001, the market broke the support line that had contained the market over the last 24-months.
Not to worry, it was simply just part of the “correction process” and many commentators on CNBC at the time were suggesting it was a “buying opportunity.”
It wasn’t.
The market rallied back, and failed, at the previously broken support line.
That point marked the end of the topping process and the beginning of the “Dot.com Crash.”
2007
In 2006, the market was rallying as “real estate” was going wild across the country. Firms were hocking every type of exotic mortgage derivative they could find, leverage being laid on without concern, and pension funds were being pitched “high yield” opportunities.
As the market broke out to new highs, there was little concern as there was “no recession in sight,” “subprime mortgages were contained,” and it was a “Goldilocks economy.”
Over the next year the market repeatedly hit new highs. Each new high was followed by a decline which tested broadening support giving the bulls repeated opportunities to call for “dip buying.”
It was believed the year-long consolidation process was simply the “set up” for the continuation of the bull market.
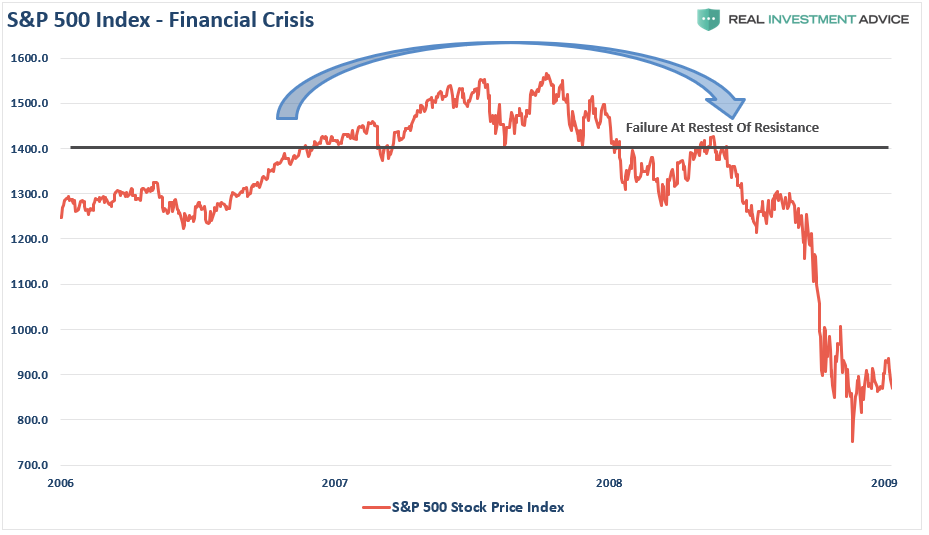
In early 2008, the running support line was broken as “Bear Stearns” failed sending off alarm bells to which few listened. The market rallied backed, and failed, at the previously broken support line.
That point marked the end of the topping process and the real beginning of the“Financial Crisis.”
By now, you should realize the similarities between all of these previous market tops and what is happening currently. However, it wasn’t just price movements that each of these previous bear markets had in common with the market today.
Fundamental similarities existed also:
- Valuations were high
- Dividend yields were low
- Federal Reserve was hiking interest rates
- Economy was believed to be strong
- Earnings were expected to continue to grow
- Corporate balance sheets were believed to be strong
- Yield curve was flattening
- “There was no recession in sight.”
The Big Test
Over the next couple of weeks, the market is going to face the “test” that has defined the “bear markets” of the past.
With the markets already back to very overbought conditions, multiple moving averages just overhead, and previously broken support; the market is going to have its work cut out for it.
However, if the bulls can regain control and push prices back above the November highs, then the “bear market correction of 2018” will officially be dead.
But such is only one possibility out of many others which pose a far greater risk to capital currently.
With the Fed continuing to extract liquidity, economic data slowing, and earnings likely to be weaker than expected, the current bounce is likely to be just that.
As we have continuously repeated, if you didn’t like the November-December decline, it is simply a function that you have built up more uncontrolled risk in your portfolio than you previously realized.
Use this rally to rebalance risk, sell losers and laggards, and add to fixed income and cash.
Conclusion
We noted previously that we remain long many of our core holdings and in November and late December added positions in companies which had been discounted due to the market’s downdraft.
This past week, we did reduce our equity exposure by 6% to remove some positions which have not been performing as well as expected.
The risk to the market remains high, but that doesn’t mean we can’t make money along the way.
Until the bullish trend is returned, we will continue to run our portfolios with a bit higher level of cash, fixed income, and tighter stops on our current long-equity exposure.
We are excited about the opportunity to finally be able to add a “short book” to our portfolios for the first time since 2008. It is too early in the market transition process to implement such a strategy, but the opportunity is clearly forming.
THE REAL 401k PLAN MANAGER
A Conservative Strategy For Long-Term Investors
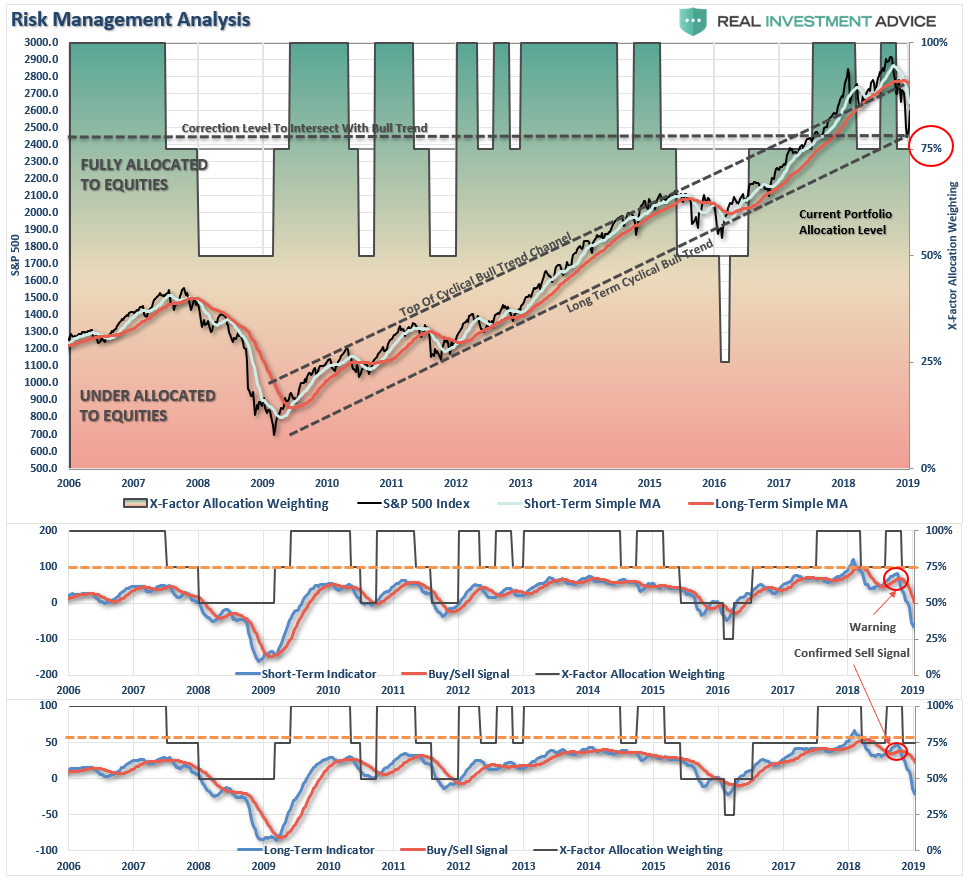
There are 4-steps to allocation changes based on 25% reduction increments. As noted in the chart above a 100% allocation level is equal to 60% stocks. I never advocate being 100% out of the market as it is far too difficult to reverse course when the market changes from a negative to a positive trend. Emotions keep us from taking the correct action.

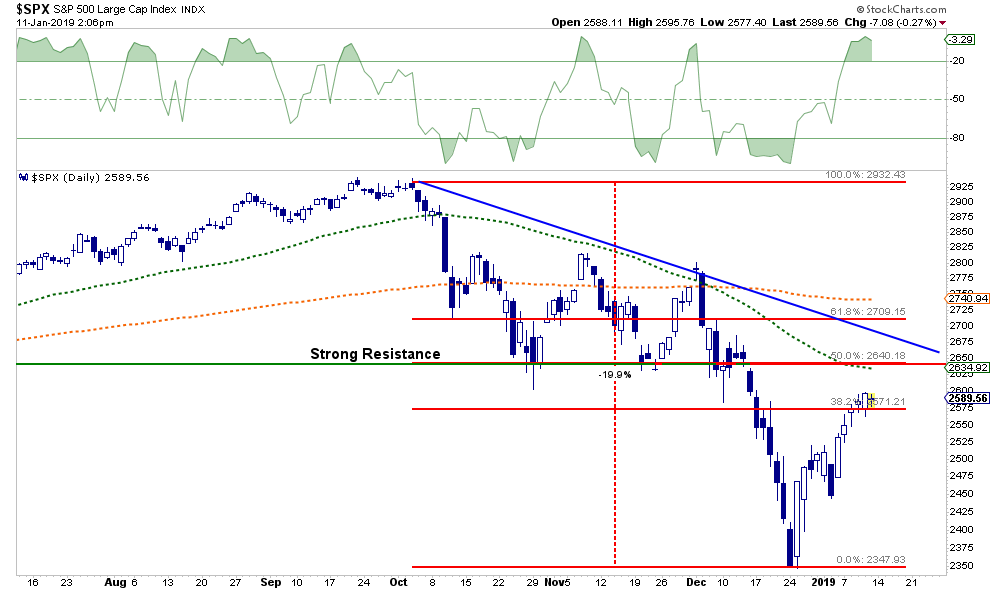
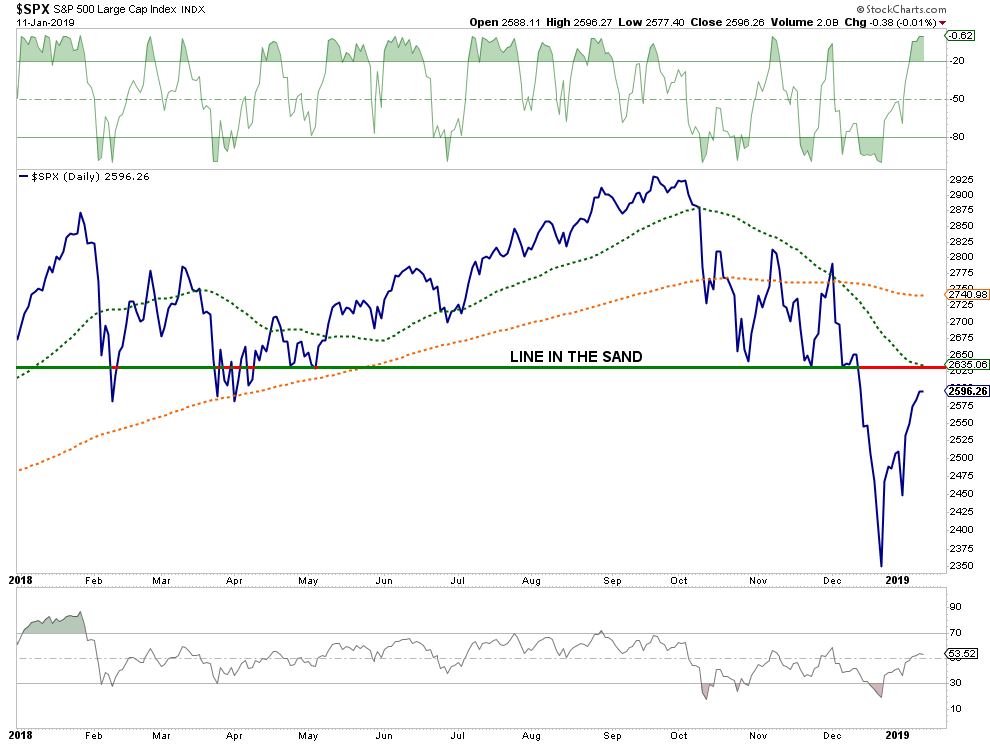
Rally Runs Into Resistance
As I noted last week:
“Well, we finally got the rally we were looking for which could possibly extend into next week. However, as I have stated previously, with sell signals triggered on both a weekly and monthly basis, these ‘clearing rallies’ should be used to reduce equity risk to the markets.
In the coming weeks, any rally that takes the markets back to short-term over ‘bought’ conditions will be used to lower equity exposure to 50%, or a target or 30% equity in our 60/40 model.”
This week, the market is indeed pushing up into short-term overbought levels and is testing the underside of important previous resistance.
One thing to note in the chart above is the horizontal dotted line that I have had drawn on the chart for the past 18-months. I noted originally that the markets break above the long-term trend channel would eventually be challenged. The recent correction has challenged that important level, if we break that confluence of support, we will be in a much more important bear market cycle.
On Monday, take some action with respect to the following, if you haven’t already:
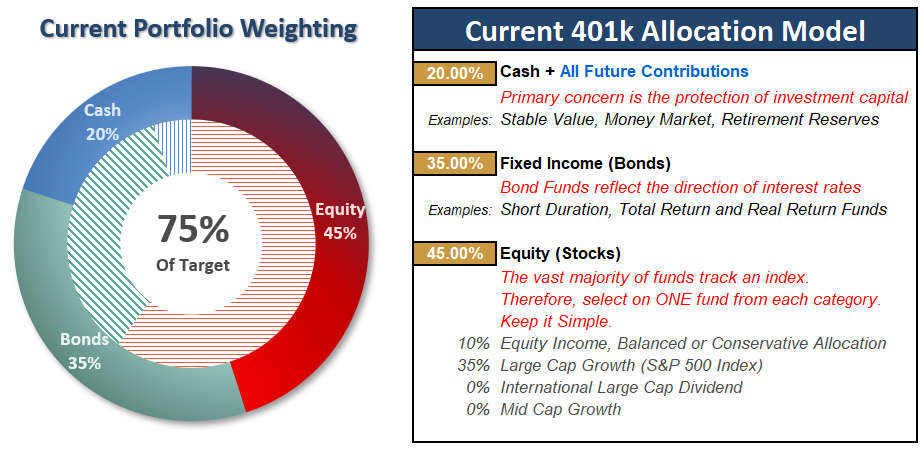
- If you are overweight equities – reduce international, emerging market, mid, and small-capitalization funds on any rally next week. Reduce overall portfolio weights to 75% of your selected allocation target.
- If you are underweight equities – reduce international, emerging market, mid, and small-capitalization funds on any rally next week but hold everything else for now.
- If you are at target equity allocations hold for now.
Continue to use rallies to reduce risk towards a target level with which you are comfortable. Remember, this model is not ABSOLUTE – it is just a guide to follow.
Unfortunately, since 401k plans don’t offer a lot of flexibility and have trading restrictions in many cases, we have to minimize our movement and try and make sure we are catching major turning points.
We want to make sure that we are indeed within a bigger correction cycle before reducing our risk exposure further.
Current 401-k Allocation Model
The 401k plan allocation plan below follows the K.I.S.S. principle. By keeping the allocation extremely simplified it allows for better control of the allocation and a closer tracking to the benchmark objective over time. (If you want to make it more complicated you can, however, statistics show that simply adding more funds does not increase performance to any great degree.)
401k Choice Matching List
The list below shows sample 401k plan funds for each major category. In reality, the majority of funds all track their indices fairly closely. Therefore, if you don’t see your exact fund listed, look for a fund that is similar in nature.

Disclosure: Don’t forget to grab a cup of coffee and start your trading/investing day with me as I kick off my new radio show.
Streaming Live On The Web
The ...
more

