
Boxed Out
Despite years of rapid revenue growth, profitability remains elusive for this cloud-based storage provider. Going forward, despite expanding into workflow optimization and enterprise security, the path to profitability is clouded at best. Entrenched competition is well-positioned to take more market share and grow faster, but the stock is priced for the opposite. This week’s Danger Zone pick is Box Inc. (BOX: $17/share).
We first warned about Box after its IPO in January 2015. Since then, BOX is down 23% while the S&P 500 is up 70%. We also recently put its peer, Dropbox (DBX), in the Danger Zone. Box faces the same competitive challenges to achieving any level of profitability as Dropbox. Box’s slightly smaller user base and worse profitability makes its stock equally risky, especially for fiduciaries.
This report helps investors of all types see just how extreme the risk in BOX is based on:
- Competition deeply integrated with target customers limits revenue potential
- Slowing YoY revenue and user growth
- Rising costs per user
- Doing the math: the stock price implies Box will triple its paying users, which would equal over 23% of Microsoft Office 365 users.
Slowing Revenue Growth Rates Expected
While Box has grown revenue by 42% compounded annually since 2013, the firm’s year-over-year (YoY) revenue growth rate has fallen from 40% in fiscal 2016 to 14% in fiscal 2020. Consensus estimates show that the market expects the firm’s revenue growth rate to decline from 10% in fiscal 2021 to just 4% in fiscal 2024. Consensus estimates also imply Box will lose market share given that the global cloud storage market is expected to grow by 22% compounded annually from 2020 to 2025.
Figure 1: Box’s YoY Revenue Growth: 2014-2024
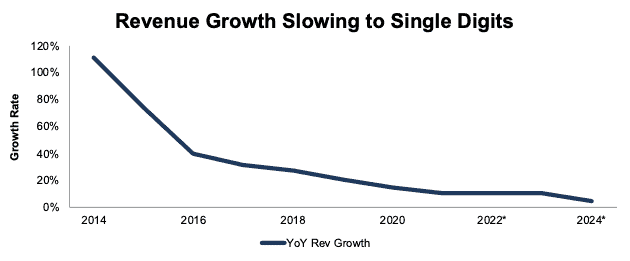
Sources: New Constructs, LLC, and company filings
*Consensus estimates
Growth of Paying Users Is Slowing
Despite investing in more enterprise-focused features, such as security/encryption, threat detection, and automation and workflow management, Box has been unable to ramp up the growth of paying users.
Box’s paying users, its only source of revenue, are growing more slowly than in years past. Per Figure 2, the YoY growth in paying users has fallen from 58% in 2017 to 18% in 2Q20. Before COVID-19 increased demand for all cloud/internet services, Box’s paying users grew just 9% YoY in fiscal 2020.
Figure 2: Box’s YoY Change in Paying Users Since 2017
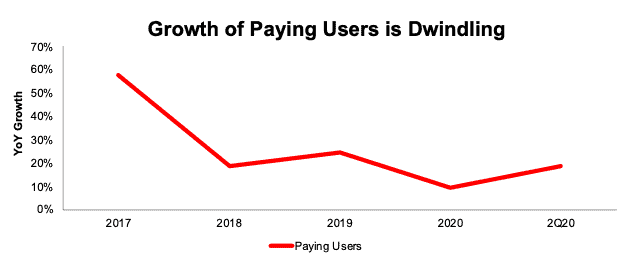
Sources: New Constructs, LLC and company filings
Costs Per User Are Rising
As Box’s paying user growth slows, the costs of operating its business are increasing on a per user basis. Per Figure 3, Box’s cost of revenue per user has increased from $2.16/user in 2017 to $3.00/user over the TTM.
Figure 3: Box’s Cost of Revenue Per User: 2017-TTM
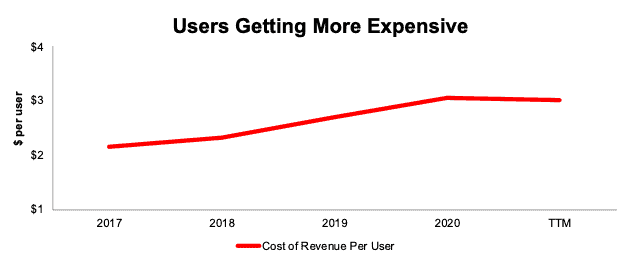
Sources: New Constructs, LLC and company filings
If we include research & development, sales & marketing, and general and administrative expenses, operating costs per user have increased from $10.56/user in 2017 to $11.30/user over the TTM.
Paying Users Retention Is Falling
As its competition expands offerings and takes more market share, Box is retaining paying users at a lower rate than in prior years. Box’s retention rate has fallen from 144% in 2013 to 106% in 2Q20, per Figure 4.
Figure 4: Box’s Retention Rate: 2013-2020
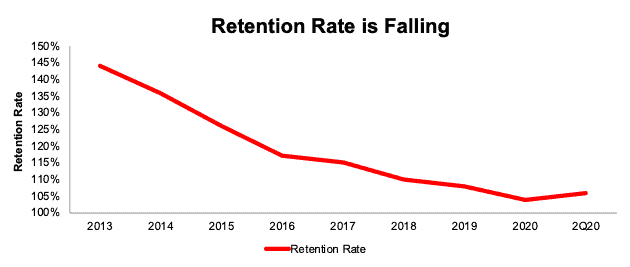
Sources: New Constructs, LLC and company filings
Growth During Work From Home Boom Lagged Competition
As COVID-19 forced most businesses to adapt their operations to be more remote-friendly, Box was in a prime position to gain market share.
But, it lost market share. Box’s revenue grew 11% YoY in 2Q20 and 12% YoY in 1H20. By comparison, Google Cloud’s revenue increased 43% YoY in 2Q20, and Microsoft grew its commercial cloud revenue by 39% YoY over the same period. Even Dropbox grew revenue faster, 16% YoY in 2Q20. If Box cannot outgrow the competition in such a favorable environment, when will it?
Competitors’ Offerings Are Cheaper and Easier to Access
Most of Box’s target customers already get Box-like services from Microsoft, Apple, or Google, who also offer other, more important, services such as word processing, spreadsheet/data management, or video conferencing tools. In comparison, Cloud storage is a low-value add-on.
To say the least, Box faces an uphill battle for Microsoft, Apple, or Google users. Why would Microsoft or Google users even think of using an outside/3rd-party Cloud storage vendor when Microsoft OneDrive is built directly into Microsoft’s applications and Google Drive is integrated directly into Google Workplace?
Box pitches direct integration with Microsoft and Google as a selling point. However, once a user is paying for Microsoft and Google, why would they want to pay extra to use an outside app to edit and manage files when they get the same service from within Microsoft and Google?
Box faces the same challenge with Apple users. Apple offers all of its customers 5 GB of free iCloud storage, which is integrated into all iPhones and iPads.
Weak Customer Relationships Limit Growth
Box’s target customers have much deeper and longer-standing relationships with Google, Microsoft, Apple, and Amazon.
Should anyone expect that cloud storage, as a standalone offering in any form, would be enough to lure customers away from these competitors?
Figure 5 shows how successful Google, Microsoft, Apple, and Amazon have been at acquiring and keeping users. We see no reason that they will cede any users to Box when they can continue to easily replicate Box’s offerings at a lower cost.
Figure 5: Box & Competitors’ Users
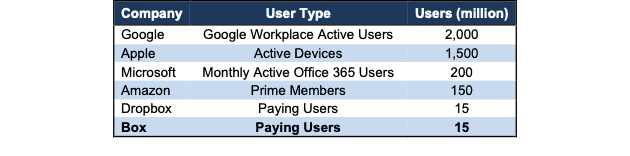
Sources: New Constructs, LLC and company filings
Inferior Offering at Higher a Price Is a Deal Killer
Figure 6 shows that Box’s free offering provides more space than all but Google. However, its paid personal plan costs the same as Apple and Google but offers significantly less storage.
Figure 6: Box & Competitors’ Cloud-Based Storage Plans
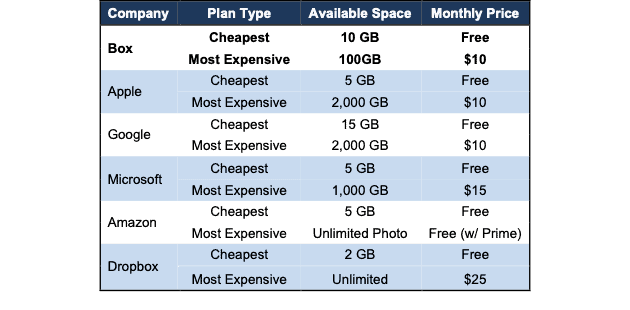
Sources: New Constructs, LLC
All of Box’s Peers Are More Profitable, Too
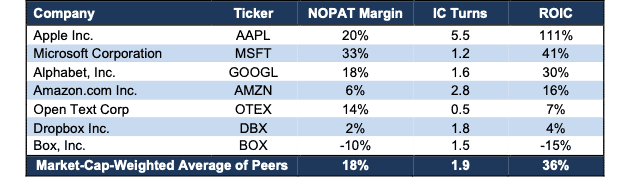
Box’s net operating profit after-tax (NOPAT) margin of -10% is well below its competitors and the market-cap-weighted peer group average margin of 18%. The peer group includes 121 Software firms under coverage.
Box’s invested capital turns, a measure of balance sheet efficiency, rank below four of the five competitors listed in Figure 7. Box’s return on invested capital (ROIC) ranks last of the group, and is the only negative ROIC of the group as well.
Figure 7: Box’s Peers Are More Profitable
Sources: New Constructs, LLC, and company filings
Box’s Still Lacks Profits
While Box’s revenue has improved significantly, the firm’s core earnings[1] remain highly negative and we do not believe the firm will be able to meet the expectations for future profit growth implied by its share price, given the competitive obstacles outlined above. Per Figure 8, Box’s core earnings have only improved from -$111 in 2013 to -$85 million TTM. Despite operating for nearly a decade and a half, Box still cannot generate positive core earnings.
Figure 8: Box’s Revenue and Core Earnings Since 2013
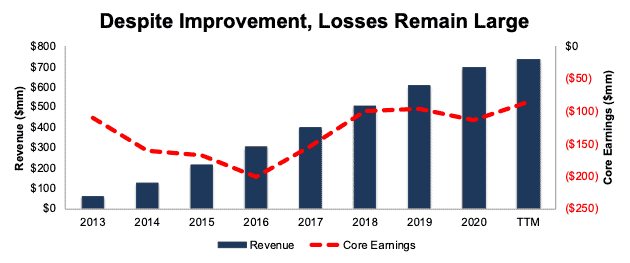
Sources: New Constructs, LLC, and company filings
Box Is Priced to Reach Nearly 45 Million Paying Users or 39% of Microsoft Teams Users
Despite facing larger and more integrated competition, Box is priced as if it will quickly achieve profitability while also significantly increasing its paying users.
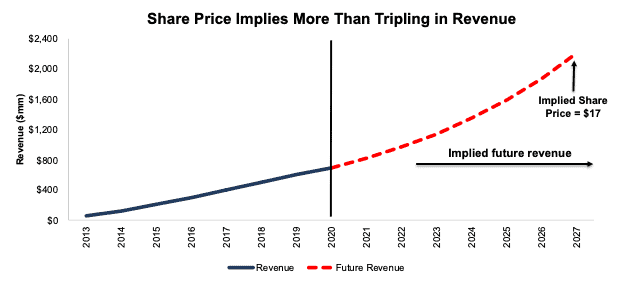
To justify its current price of $17/share, Box must:
- Grow revenue at 18% (double consensus estimates through 2024) compounded annually over the next seven years.
- Immediately achieve a 7% NOPAT margin, which is more than 3x higher than Dropbox’s NOPAT margin of 2% and greater than Amazon’s TTM margin of 5%). For reference, Box’s TTM NOPAT margin is -10% TTM.
See the math behind this reverse DCF scenario. In this scenario, Box grows revenue by 18% compounded annually for seven years and reaches $2.2 billion in revenue in 2027, or three times 2020 revenue and 22% greater than Dropbox’s TTM revenue.
It is also worth noting that the revenue growth expectations embedded in the current valuation of BOX are meaningfully higher than consensus analyst expectations, which average 9% compounded annually through 2024.
Figure 9: Current Valuation Implies Unrealistic Revenue Growth
Sources: New Constructs, LLC and company filings.
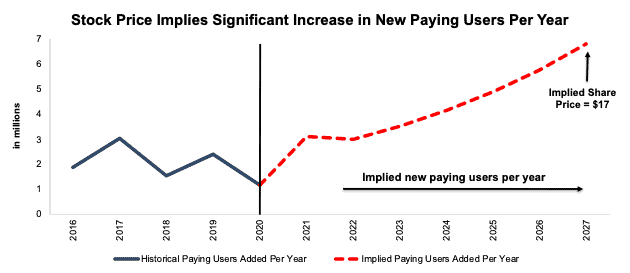
Box’s Paying Users Need to Triple to Justify Valuation
To further illustrate the high growth expectations embedded in Box’s stock price, we compare the number of new paying users Box has added in years past compared to the number of new paying users per year implied in the scenario above. See Figure 10. By dividing the implied revenue in 2027 of $2.2 billion by the firm’s TTM average revenue per paying user of $50, we arrive at ~45 million implied paying users in 2027, compared to 15 million in 2Q20.
In other words, Box’s current valuation implies the company will triple its paying user base, which equals 39% of Microsoft Teams daily active users.
We think it is difficult to make a straight-faced argument that Box can achieve such increased user growth with a less integrated product.
Figure 10: Historical vs. Implied New Paying Users Per Year
Sources: New Constructs, LLC and company filings.
Box Has Significant Downside With Consensus Growth
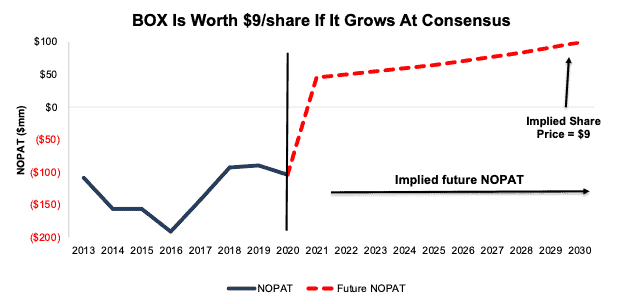
If we assume revenue growth in-line with consensus, BOX has a significant downside.
In this scenario, we assume Box will:
- Grow revenue at 9% compounded annually over the next decade
- Immediately achieve a 6% NOPAT margin (triple Dropbox’s TTM margin)
See the math behind this reverse DCF scenario. In this scenario, Box grows revenue from $767 million TTM to $1.6 billion in 2030 and the stock is worth just $9/share – a 49% downside.
Figure 11 compares the firm’s implied future NOPAT in this scenario to its historical NOPAT.
Figure 11: BOX Has Large Downside Risk: DCF Valuation Scenario
Sources: New Constructs, LLC and company filings.
Each of the above scenarios also assumes Box is able to grow revenue, NOPAT, and free cash flow (FCF) without increasing working capital or fixed assets. This assumption is highly unlikely but allows us to create best-case scenarios that demonstrate how high expectations embedded in the current valuation are.
Acquisition Would Be Unwise
Often the largest risk to any bear thesis is what we call “stupid money risk”, which means an acquirer comes in and buys Box at the current, or higher, share price despite the stock being overvalued. Given our analysis above, the only plausible justification for BOX trading at such a high price is the expectation that another firm will buy it. We think potential acquirers would be better off leaving cloud storage to the firms that can offer cloud storage as a free, or cheap add-on to their deeply integrated services, but stranger things have happened than firms being acquired at unnecessarily high premiums to their intrinsic value.
Below, we quantify the high acquisition hopes that are priced into the stock.
Walking Through the Acquisition Math
First, investors need to know that Box has large liabilities that make it more expensive than the accounting numbers would initially suggest.
- $257 million in operating leases (10% of market cap)
- $61 million in outstanding employee stock options (2% of market cap)
After adjusting for all liabilities, we can model multiple purchase price scenarios. For this analysis, we chose Salesforce.com Inc. (CRM) as a potential acquirer of Box, just as we did recently with Dropbox, since Box already integrates with Salesforce’s cloud-based platform. While we chose Salesforce, analysts can use just about any company to do the same analysis. The key variables are the weighted average cost of capital (WACC) and ROIC for assessing different hurdle rates for a deal to create value.
Even in the most optimistic of acquisition scenarios, Box is worth less than its current share price.
Figures 12 and 13 show what we think Salesforce should pay for Box to ensure it does not destroy shareholder value. There are limits on how much Salesforce should pay for Box to earn a proper return, given the NOPAT or free cash flows being acquired.
Each implied price is based on a ‘goal ROIC’ assuming different levels of revenue growth. In each scenario, we use 10% revenue growth in year one and two, which equal consensus estimates. In the first scenario, we use 10% in years three through five, which represents a continuation of consensus. In the second scenario, we use 20% in years three through five. We use the higher estimates in scenario two to illustrate a best-case scenario where we assume Box could grow revenue faster while being integrated within Salesforce’s existing business.
We optimistically assume that Salesforce can grow Box’s revenue and NOPAT without spending any working capital or fixed assets beyond the original purchase price. We also optimistically assume Box achieves a 4% NOPAT margin, which is above its TTM margin of -10% and above Salesforce’s TTM margin of 1%.
Figure 12: Implied Acquisition Prices for Value-Neutral Deal – Scenario 1
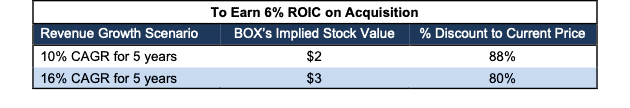
Sources: New Constructs, LLC and company filings
Figure 12 shows the implied values for Box assuming Salesforce wants to achieve an ROIC on the acquisition that equals its WACC of 6%. This scenario represents the minimum level of performance required not to destroy value. Even if Box can grow revenue by 16% compounded annually for five years and achieve a 4% NOPAT margin, the firm is worth less than $17/share. It’s worth noting that any deal that only achieves a 6% ROIC would not be accretive, as the return on the deal would equal Salesforce’s WACC.
Figure 13: Implied Acquisition Prices to Create Value – Scenario 2
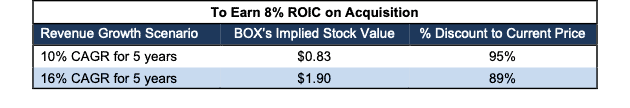
Sources: New Constructs, LLC and company filings
Figure 13 shows the implied values for Box assuming Salesforce wants to achieve an ROIC on the acquisition that equals 8% and is greater than its WACC. Acquisitions completed at these prices would be accretive to Salesforce’s shareholders. Even in this best-case growth scenario, the implied value is far below Box’s current price. Without significant increases over the margin and/or revenue growth assumed in this scenario, an acquisition of Box at its current price destroys significant shareholder value.
Catalyst – Slowing Growth Amidst Increased Expectations
At the end of January, the consensus estimate for Box’s 2020 earnings was $0.30/share. Jump forward to today, and the 2020 consensus estimate has risen to $0.58/share, despite underwhelming growth, relative to peers, during the shift to work-from-home. Box has beaten earnings in each of the past ten quarters. The combination of the firm’s slowing user growth rate and higher expectations make a future beat more difficult. Should the firm have its first earnings miss, investors could get spooked and send shares lower.
Further, Box’s relative underperformance to its stronger peers during the COVID-19 disruptions could lead investors to wake up to the fact that Box is losing market share and cause them to rotate their money into better investments.
The stock would also likely sink if competitors further weaken Box’s value proposition by offering more cloud storage at even lower prices.
What Noise Traders Miss With BOX
These days, fewer investors pay attention to fundamentals and the red flags buried in financial filings. Instead, due to the proliferation of noise traders, the focus tends toward technical trading trends while high-quality fundamental research is overlooked. Here’s a quick summary for noise traders when analyzing BOX:
- Deeply embedded competition with deeper pockets
- Slowing revenue and user growth rates
- Falling retention rate means customers are harder to keep
- Lack of significant competitive advantages
- Valuation implies massive paying user growth
Executive Compensation Plan Is Not Creating Shareholder Value
In addition to base salaries, Box’s executives earn cash bonuses and long-term equity incentive compensation. Cash bonuses are awarded based on revenue and non-GAAP operating income metrics. In other words, executives are incentivized to focus on the top line, and misleading non-GAAP metrics on the bottom line.
Long-term equity compensation is provided via performance-based stock options, which only vest if Box’s stock price reaches a target level.
With ties to revenue, non-GAAP, and stock price, it’s not surprising that the firm’s executive compensation plan has not created shareholder value. Box has generated negative economic earnings in each of the past eight years.
Box should link executive compensation with improving ROIC, which is directly correlated with creating shareholder value, so shareholders’ interests are properly aligned with executives’.
Insider Trading and Short Interest
Over the past 12 months, insiders have purchased 493 thousand shares and sold 909 thousand shares for a net effect of 416 thousand shares sold.
There are currently 7.8 million shares sold short, which equates to 5% of shares outstanding, and just under four days to cover. The number of shares sold short has increased by 1% since last month.
Critical Details Found in Financial Filings by Our Robo-Analyst Technology
As investors focus more on fundamental research, research automation technology is needed to analyze all the critical financial details in financial filings as shown in the Harvard Business School and MIT Sloan paper, "Core Earnings: New Data and Evidence”.
Below are specifics on the adjustments we make based on Robo-Analyst findings in Box’s 10-Qs and 10-K:
Income Statement: we made $64 million of adjustments, with a net effect of removing $41 million in non-operating expenses (6% of revenue). You can see all the adjustments made to Box’s income statement here.
Balance Sheet: we made $114 million of adjustments to calculate invested capital with a net increase of $4 million. One of the most notable adjustments was $88 million in excess cash. This adjustment represented 20% of reported net assets. You can see all the adjustments made to Box’s balance sheet here.
Valuation: we made $606 million of adjustments with a net effect of decreasing shareholder value by $431 million. Apart from total debt, the most notable adjustment to shareholder value was $61 million in outstanding employee stock options. This adjustment represents 2% of Box’s market cap. See all adjustments to Box’s valuation here.
Unattractive Funds That Hold BOX
The following funds receive our Unattractive-or-worse rating and allocate significantly to BOX:
- North Square Dynamic Small Cap Fund (ORSIX) – 2.6% allocation and Unattractive rating
- Transamerica Small Cap Growth Fund (ASGTX) – 2.4% allocation and Very Unattractive rating
- Ranger Small Cap Fund (RFISX) – 2.3% allocation and Very Unattractive rating
- Global X Cloud Computing ETF (CLOU) – 2.0% allocation and Unattractive rating
1 Our core earnings are a superior measure of profits, as demonstrated in Core Earnings: New Data & Evidence a paper by professors at Harvard Business School (HBS) & MIT Sloan. The paper empirically shows that our data is superior to “Operating Income After Depreciation” and “Income Before Special Items” from Compustat, owned by S&P Global (SPGI).
Disclosure: David Trainer, Kyle Guske II, and Matt Shuler receive no compensation to write about any specific stock, style, or theme.


