
Boeing: Forming The Biggest Peak Since 2003 Lows
The Stock is trading within a very technical area and it is showing a very clear 5 waves advance Elliott wave structure from its 2013 lows. When a 5 waves structure can be seen we always should be careful and pay attention to the direction of the 5 waves. Accordingly, to the Elliott Wave Theory after a 5 waves move there should be a pullback in 3 waves coming soon. The Boeing Company has been in the news lately because of an unfortunate accident related to their top-selling Aircraft which is the 737 MAX 8 jet. An Ethiopian Airlines flight crashed on Sunday only five months after the Lion Air Boeing crash in Indonesia killing 189 people.
These bad news came inline with ending the 5th wave accordingly to the Elliott Wave Theory. Consequently, a bigger pullback was expected against the main trend. In the charts below you can see the Boeing stock in the Monthly, Weekly and Daily Time frame. And when we related the price action in Boeing to other World Indices and stocks it is very possible that the blue degree wave (IV) can be around the corner. Boeing is part of the Dow Jones Industrial Average and takes the biggest percentage Weight in the Index. Which translates that a decline in Boeing will have a greater impact on the Dow Jones Industrial Average then other stocks.
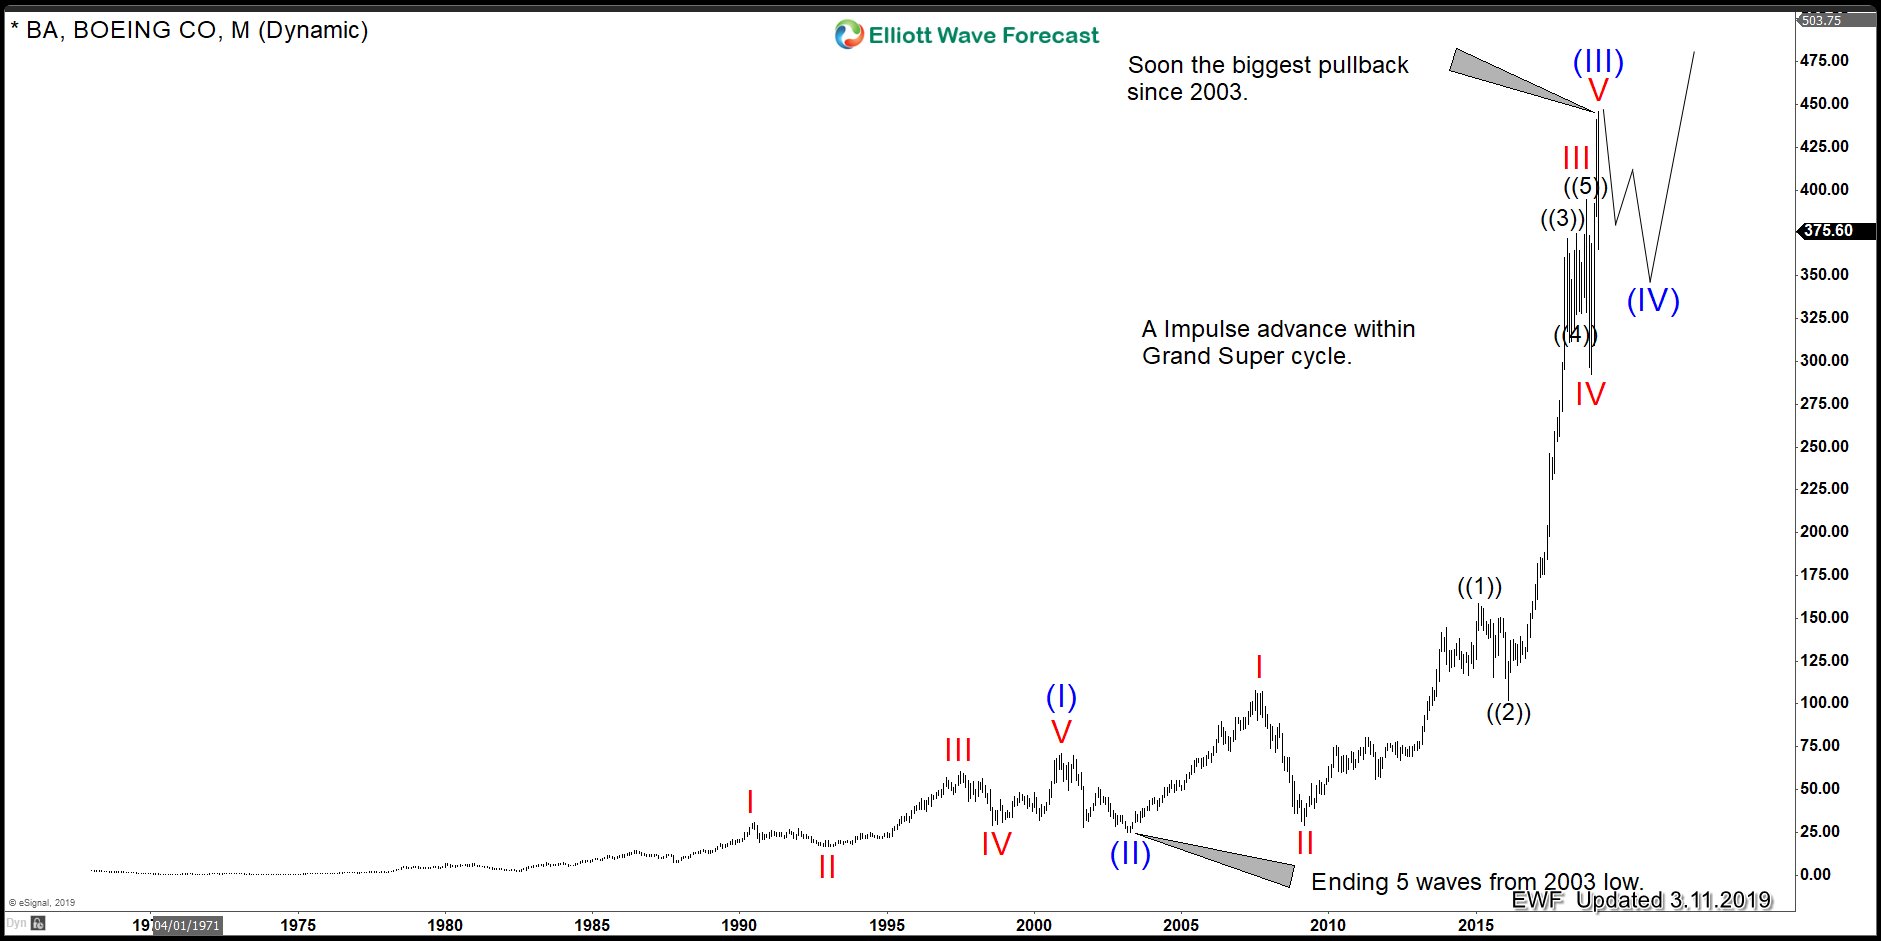
The Following chart shows the Monthly view of the stock showing the idea that blue wave (III) can be ending within the Grand Supercycle. We see a nesting structure at lower levels. And from its all-time low it is unfolding as a very clear 5 waves Elliott Wave impulse. The alternative view, however, is that the stock is just correcting the cycle from 12/26/18 cycle and can still extend within wave V.
Boeing Monthly Chart 03/11/2019
(Click on image to enlarge)
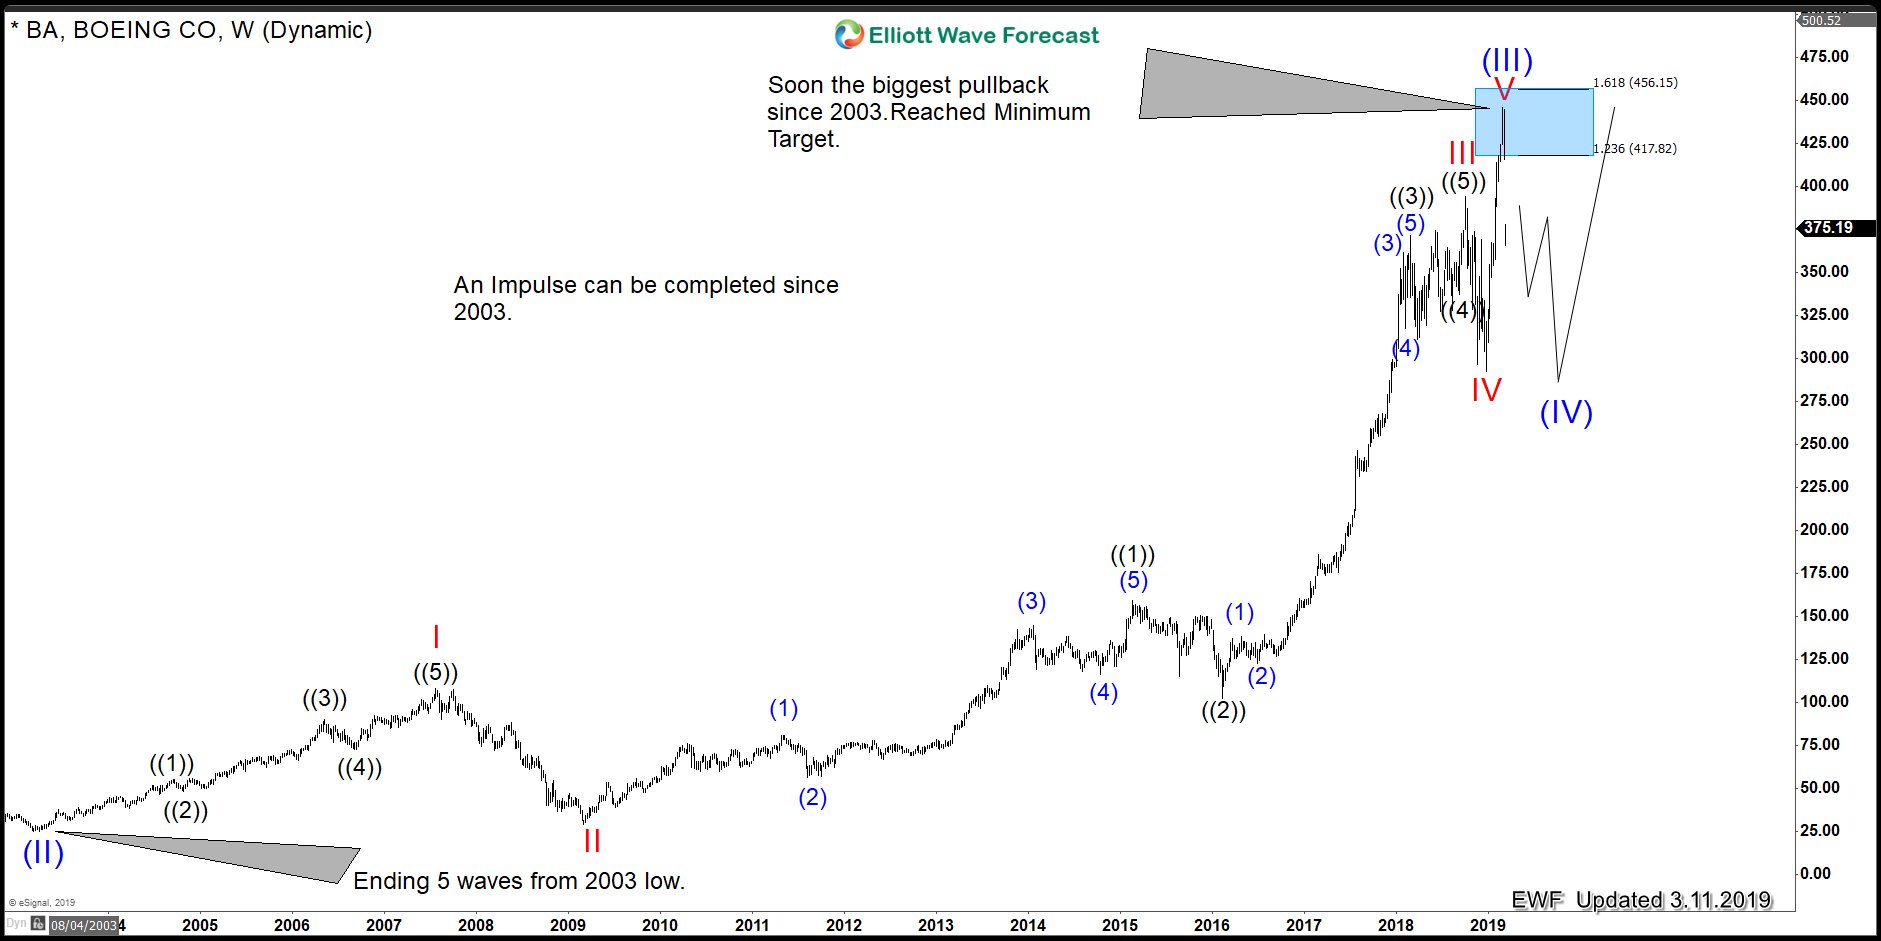
The following chart is showing the weekly view and its impulsive structure from 2009 lows. The move is clearly defined and very technical and the pullback can reach the levels of previous red wave IV at around 275 area.
Boeing Weekly Chart 03/11/2019
(Click on image to enlarge)
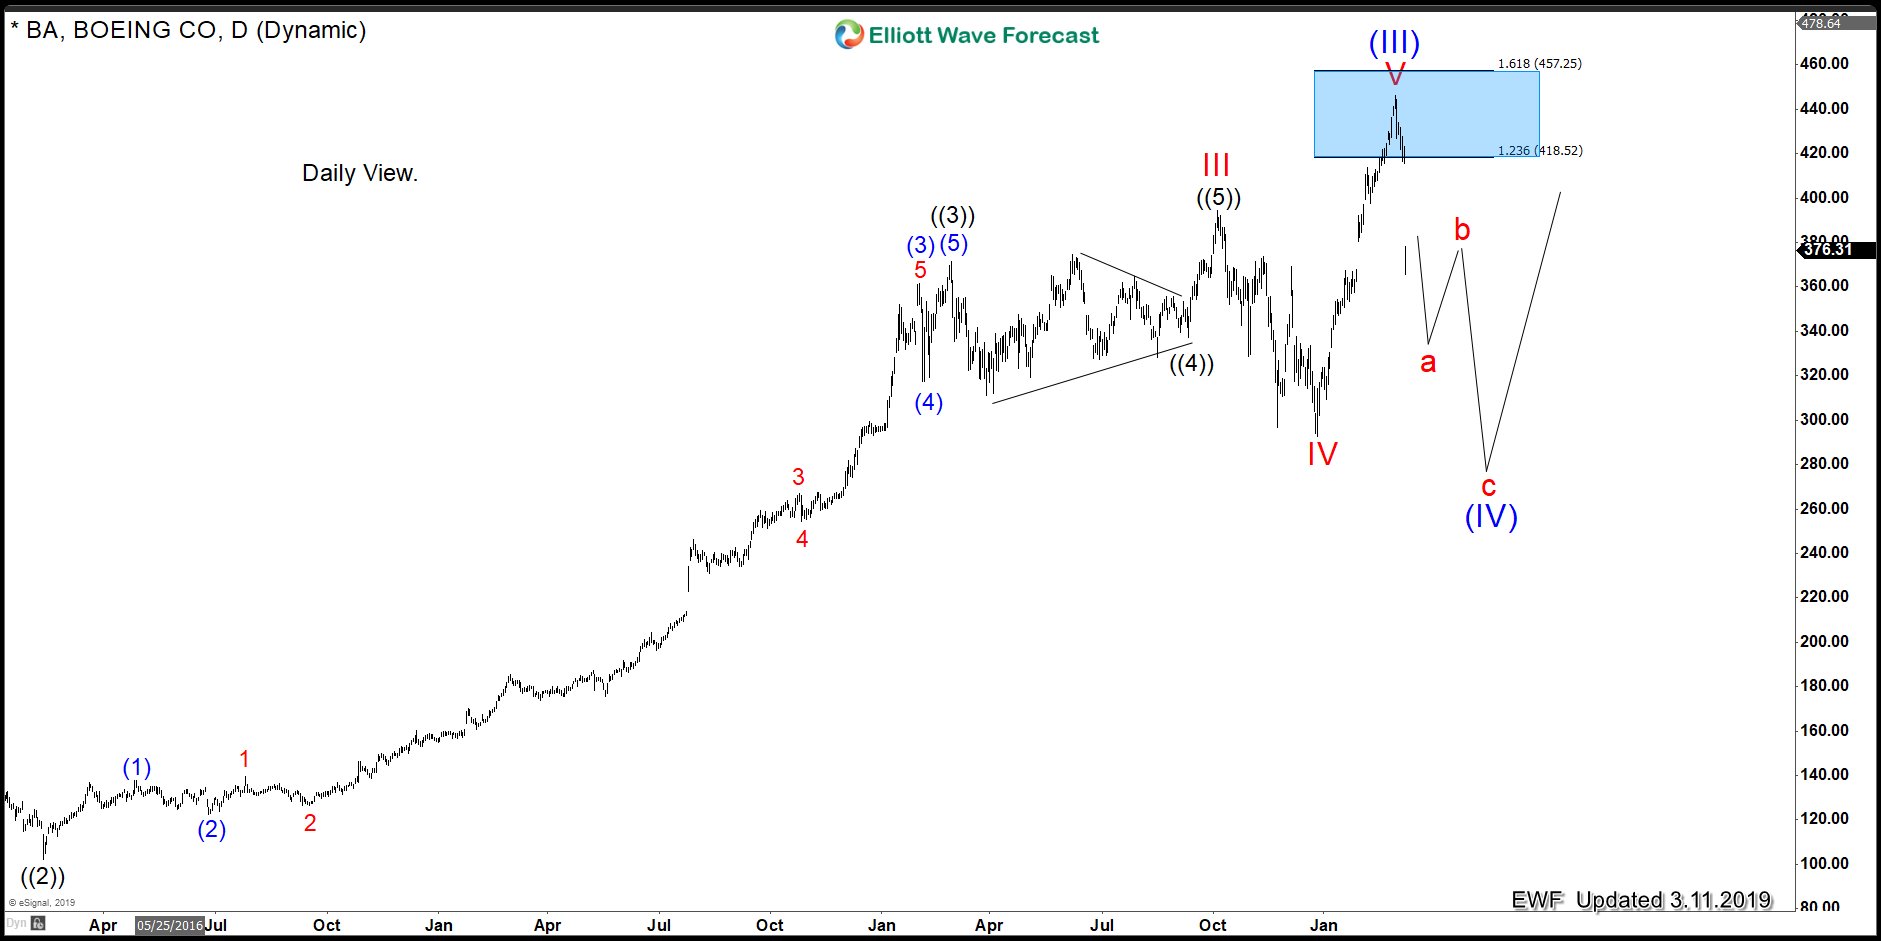
The next chart is showing the daily Elliott Wave view. You can see that the stock reached the blue box area and ended red wave V of blue wave (III). And clearly ended the cycle from 12/26/18 low.
Boeing Daily Chart 03/11/2019
(Click on image to enlarge)
As we always say to our members at Elliott Wave Forecast. The Elliott wave Theory can warn traders about future moves but more importantly, it can show the map of the Market.
Disclaimer: Futures, options, and over the counter foreign exchange products may involve substantial risk and may not be suitable for all investors. Leverage can work against you as well as for ...
more

