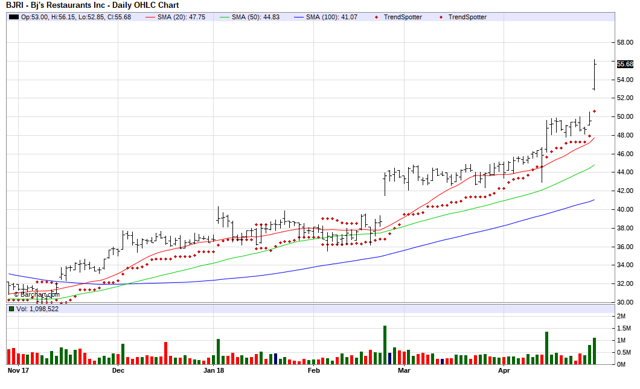
BJ's Restaurants- Chart Of The Day
The Barchart Chart of the Day belongs to BJ's Restaurants (BJRI). I found the retail restaurant chain by using Barchart to sort today's New 52 week high list first by the most frequent number of new highs in the last month then again by technical buy signals of 80% or more. Next, I used the Flipchart feature to review the charts for consistent price appreciation over the last 6 months. Since the Trend Spotter signaled a buy on 2/15 the stock gained 41.28%.
BJ's Restaurants, Inc. owns and operates the restaurants, located in USA. Each of their restaurants is operated either as a BJ's Restaurant & Brewery which includes a brewery within the restaurant, a BJ's Restaurant & Brewhouse which receives the beer it sells from one of their breweries or independent third party brewers of our proprietary beer recipes, or a BJ's Pizza & Grill which is a smaller format, full-service restaurant with a more limited menu than our other restaurants. Their menu features their BJ's award-winning, signature deep-dish pizza, their own handcrafted beers as well as a wide selection of appetizers, entrees, pasta, sandwiches, specialty salads and desserts including their unique Pizookie dessert. Several of their BJ's Restaurant & Brewery restaurants feature in-house brewing facilities where BJ's proprietary handcrafted beers are produced for many of their restaurants.

Barchart's Opinion trading systems are listed below. Please note that the Barchart Opinion indicators are updated live during the session every 10 minutes and can, therefore, change during the day as the market fluctuates. The indicator numbers are shown below, therefore, may not match what you see live on the Barchart.com website when you read this report.
Barchart technical indicators:
- 100% technical buy signals
- Weighted Alpha of 49.28+
- 31.37% gain in the last year
- Trend Spotter buy signal
- Above its 20, 50 and 100 day moving averages
- 17 new highs and up 27.77% in the last month
- Relative Strength Index 82.16%
- Technical support level at 48.93
- Recently traded at 55.60 with a 50 day moving average of 44.83
Fundamental factors:
- Market Cap $1.02 billion
- P/E 34.02
- Dividend yield .45%
- Revenue expected to grow 4.60% this year and another 3.30% next year
- Earnings estimated to increase 27.00% this year, an additional 11.70% next year and continue to compound at an annual rate of 15.30% for the next 5 years
- Wall Street analysts issued 3 strong buy, 9 hold and 1 under perform recommendation on the stock
Disclosure: None.


