
Bidding Continues On EBAY
EBAY is another stock which has been trading around the volume point of control for some time and is one where patience is required before jumping in too early, and again we have some key volume price analysis lessons on this chart.
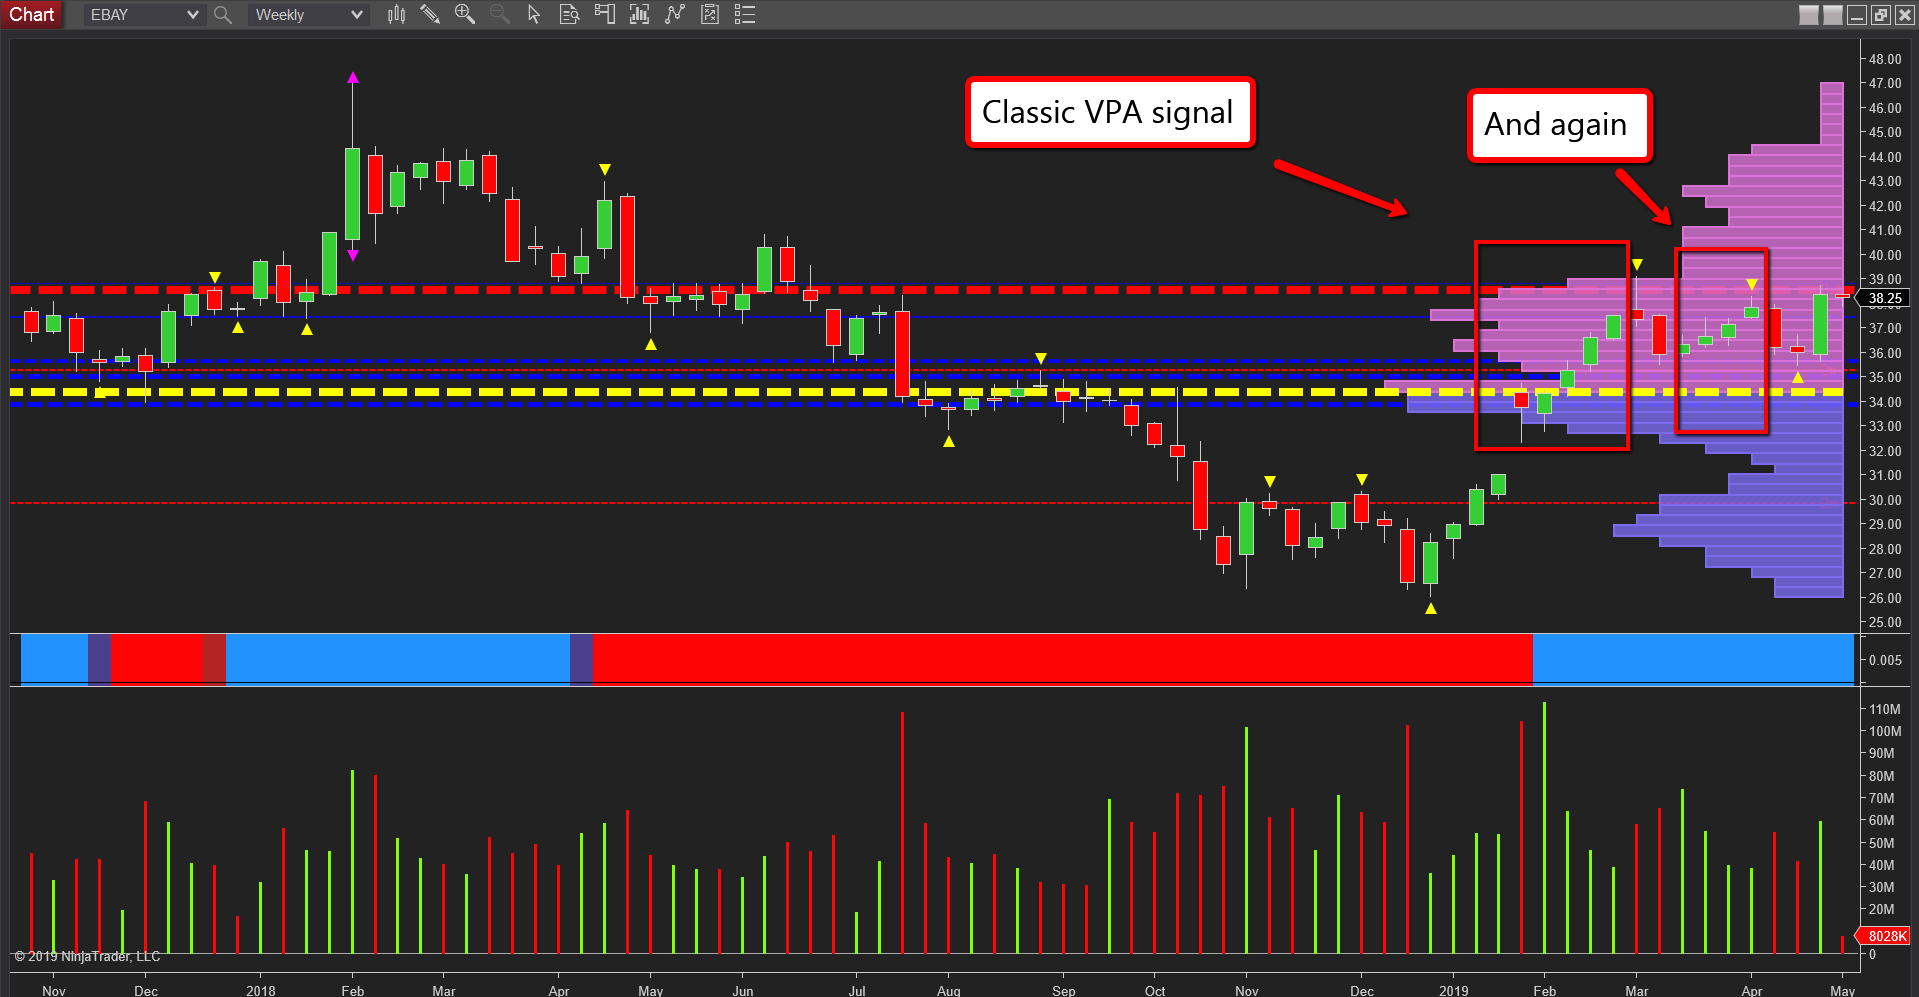
If we start with the important levels, the ceiling of resistance at $38.50 defines the weekly chart for the stock. This level has been tested several times this year, most recently last week, as it capped off a solid week of gains with a wide spread up candle on excellent volume. This ceiling of resistance is denoted with the wide red dashed line of the accumulation and distribution indicator which clearly shows the strength of this area. The start of the trading week has been seen muted price action, but once this level is breached this will then provide an excellent platform of support to a further move higher, with volume also falling away on the price axis the further we move away from the VPOC itself. With little in the way of defined price resistance then ahead, this should provide a clear path for a solid move higher in the longer term.
Finally, notice within the rallies of 2019 how price action has risen, yet volume has been falling, and soon after results in a minor correction on weakness. These two are classic signals of volume price analysis.
(Click on image to enlarge)
Disclaimer: Futures, stocks, and spot currency trading have large potential rewards, but also large potential risk. You must be aware of the risks and be willing to accept them in order to invest in ...
more

