
Better Bank Stock: Bank Of America Or JPMorgan Chase?

Introduction
Bank of America (BAC) and JPMorgan Chase (JPM) are among the “big four” banks in the United States. BAC and JPM have $2.25 trillion and $2.56 trillion of total assets respectively. Both have been through the Great Recession and weathered the storm. In this article, we will compare both banks’ past stock performance, financial and operating metrics, balance sheets and dividends, to analyze which bank is the better one.
Past Performance
Let us begin by comparing BAC and JPM’s past shares performance. The top chart below shows both banks’ return in the past 5 years and the bottom chart shows the total return including dividends in the past 5 years.
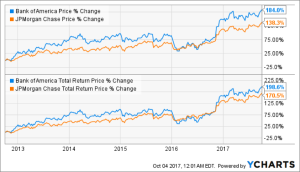
Source: YCharts.Com
As the top chart shows, BAC generated a return of 184% since late 2012 while JPM generated a return of 138.3%. If we included dividends, the difference is narrowed with BAC and JPM generating 198.6% and 170.5% returns respectively. JPM’s dividend yield was higher than BAC's in the past 5 years.
Earnings & Growth Analysis
BAC has four operating segments: Consumer Banking, Global Wealth and Investment Management, Global Banking, and Global Markets. In its past quarter, the bank delivered a net income of $5.3 billion, a growth of 10% year over year. Its Consumer Banking segment reported $3.9 billion earnings or an increase of 14% year over year. In its Global Wealth and Investment Management segment, the firm delivered $804 million in net income in the past quarter. This was up by 14% year over year. In Global Banking, net income also increased by 19%, to $1.79 billion. Finally, in Global Markets, its net income was $928 million in the past quarter or a decline of 24% due to lower sales and trading results.
Moving forward, the bank is expected to execute its expense-control initiatives. Management wishes to keep its expense to be less than $53 billion per year or about $13 billion per quarter. With increasing revenue and a flat expense, we expect the firm’s earnings to grow at a faster pace than the revenue growth rate. By looking at the proportion of its expense to its revenue, a 10% increase in revenue would result in an earnings growth of 30% assuming expense remains the same. With an improving economy and Fed rate hikes expected, BAC’s net interest margin is expected to continue to improve.
In JPM’s latest quarterly result, the bank delivered a net income of $7.0 billion or a growth rate of 13.4% due to 4.5% growth in revenue and management’s effort to control its expense. Similar to BAC, the bank has four segments: Consumer & Community Banking, Commercial Banking, Asset & Wealth Management, and Corporate & Investment Bank. In Consumer & Community Banking segment, its quarterly income was $2.22 billion, or a decrease of 16% year over year. Its Commercial Banking segment delivered net income of $902 million, or a growth of 30% year over year. In its Corporate & Investment Bank segment, its net income was $2.71 billion, or a growth of 9% year over year. Its Finally, its Asset & Wealth management delivered $624 million of net income, or a growth of 20% year over year.
Like BAC, JPM is also focusing its effort to lower costs through branch efficiencies and its simplification program. The company expects its 2017 non-interest expense to be $58 billion, a slight decline of $0.4 billion from 2016. The company also provides guidance on how Fed’s interest rate hike will aid its net interest income. Management expects its net interest income to reach $11 billion if Fed’s interest rate hike eventually reached 3% in 2019. This would be $7 billions more than its current net interest income projection in 2017.
Both banks should benefit from the policies of the new presidential administration which may include less strict financial regulation, reduced compliance costs, tax reform, etc. At the moment, it is still unclear whether and how much these policies will be implemented.
Financial and Operating Metrics Comparison
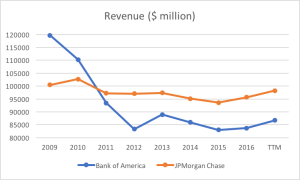
Let us begin by comparing both banks’ revenues. As the chart below shows, both banks continued to face revenue decrease in the years after the Great Recession due to declining net interest income and bank fees. Since 2015, both banks' revenue returned to positive growth and the momentum continues to accelerate in the trailing 12-months.
Source: Created by author, Company Reports
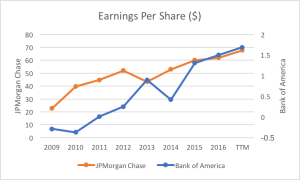
Both banks were able to grow their EPS steadily coming out of the Great Recession. JPM’s EPS grew to $22.6 per share to $67.7 per share in the trailing 12-months while BAC’s revenue grew to $1.69 per share from negative territory.
Source: Created by author, Company Reports
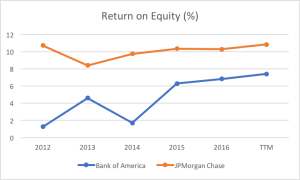
In terms of Return on Equity, both banks continue to improve their ROE in the past 3~4 years. JPM enjoys above 10% ROE, higher than BAC’s 6% ~ 8% ROE. JPM typically leads BAC by about 350 basis points.
Source: Created by author, Company Reports
Below is the chart of both banks’ Returns on Assets for the past 5 years. As we can see, the historical ROA trend is similar to the ROE trend above. JPM’s near 1% ROA in the trailing 12-months is about 20 basis points higher than BAC’s 0.8%.
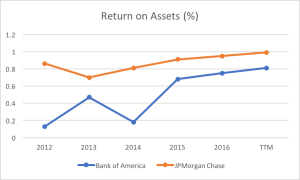
Source: Created by author, Company Reports
We will now compare both banks’ efficiency ratios. Efficiency ratio measures operating expense (does not include interest expense) as a percentage of net revenues. The ratio shows how well the bank is managing its revenue. Generally, the lower the efficiency ratio, the better. As we can see from the chart below, JPM has lower efficiency ratio in the past 10 quarters. As we can see from the trend, both banks continue to improve its efficiency ratio year over year.
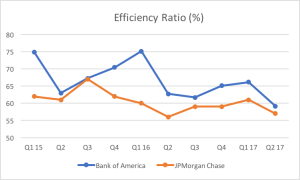
Source: Created by author, Company Reports
Now, we will compare JPM and BAC’s net interest margins. Net interest margin looks at net interest income as a percentage of average earning assets. In the graph below, we have included both banks’ net interest margins in the past 10 quarters. As illustrated in the graph, both banks have comparable net interest margins in the past 4 quarters with BAC’s net interest margin of 2.34% slightly ahead of JPM’s 2.31% in Q2 2017. With more Fed rate hikes expected towards the end of the year, and next year, both banks’ net interest margin is expected to continue to improve.
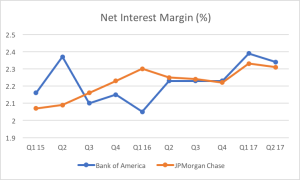
Source: Created by author, Company Reports
Dividend Growth and Sustainability
BAC currently pays a quarterly dividend of $0.12 per share or about 1.86% yield. On the other hand, JPM pays a quarterly dividend of $0.56 per share or about 2.30% yield. Both had to significantly reduce its dividend during the Great Recession., and both have resumed its dividend payment. BAC’s latest dividend payment was increased by $0.045, or a growth rate of 60%. On the other hand, JPM’s next dividend payment is an increase of $0.06 or a growth of 12% from its previous payment.
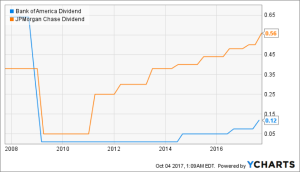
BAC and JPM’s Dividend (Source: YCharts.com)
BAC’s payout ratio over the trailing 12 months is about 24%. On the other hand, JPM’s payout ratio of 33% is slightly higher. Both are sustainable. The reason for BAC’s lower payout ratio was due to the fact that its dividend increase request was denied in 2011. The bank didn’t request an increase in dividend until 2014 when its request was approved. On the other hand, JPM’s dividend increase was approved every year since 2011.
Moving forward, BAC is expected to return $17 billion of cash through higher dividends and net share repurchases over the next four quarters (Q3 2017 to Q2 2018). On the other hand, JPM plans to spend up to $19.4 billion on share buybacks over the next four quarters.
Valuation
JPM has a forward PE ratio of 12.9x based on the consensus estimates on the bank’s fiscal 2018 EPS of $7.56. On the other hand, BAC’s forward PE ratio is 12.0x based on the consensus estimates on the bank’s fiscal 2018 EPS of $2.15. Compared to JPM, BAC appears to be slightly undervalued. In terms of Price to Book ratio, JPM’s PB ratio is 1.47x, higher than BAC’s 1.1x.
Investor Takeaway
JPM appears to have better ROE, ROA, and efficiency ratio than BAC. However, BAC may have better dividend growth potential due to its lower payout ratio. In terms of valuation, BAC’s PE and PB ratios are below JPM's. If BAC can continue to deliver consistent strong earnings growth in the future, the market may gradually raise its PE and PB ratio. In terms of future prospects, both banks should see growth in net interest incomes as Fed gradually hikes the interest rate.
Disclosure: This is not financial advice and that all financial investments carry risks. Investors are expected to seek financial advice from professionals before making any investment.


I think $BAC is the better bet.
Why not buy both $JPM and $BAC to hedge our bets? Both look promising to me.
Good analysis, thanks.
Thank you! Nice meeting you!