
Bearish Action Emerges

The previous week’s reign of volatile intra-day moves remained for a second week.
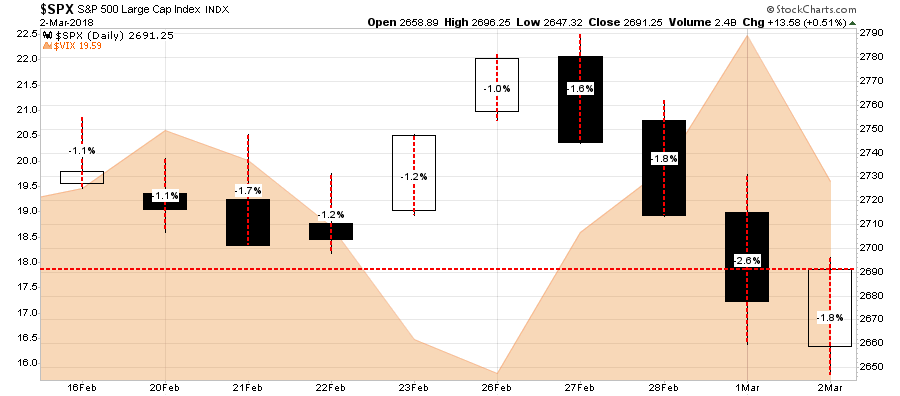
The difference this week, instead of capping off the week with a positive net return of 0.55%, prices not only once again swung wildly in excess of 1% daily but finished the week -2.04% lower.
That is volatility.
On Thursday I updated our market analysis and stated:
“If the market fails to hold the 50-dma by the end of this week, we will add our hedges back to portfolios, rebalance risk in portfolios and raise cash as needed.“
We did exactly that on Friday by reinstating our short-market hedge and raised some cash by reducing some of our long-equity exposure. While previously we had only hedged portfolios, the action this past week to simultaneously reduce some equity exposure was due to both of our primary “sell” signals being tripped as shown below.

This does not mean the next great “bear market” is about to commence, it just means that currently there is an excess of “selling pressure” in the market which could pressure equities lower.
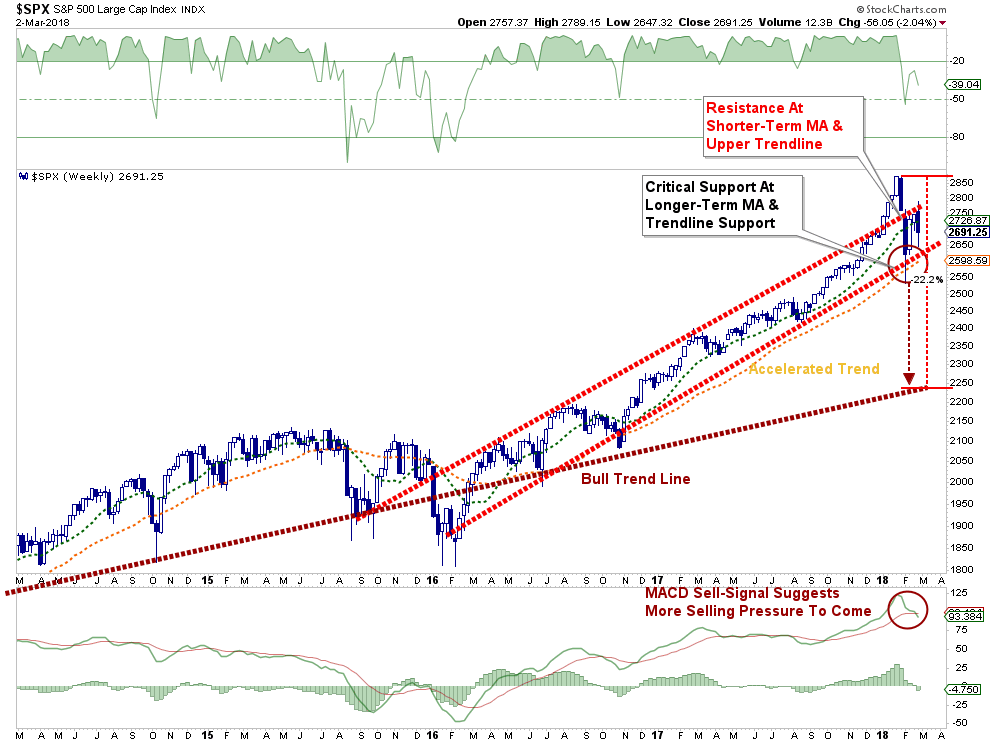
Most importantly, the market is currently in the process of building a consolidation pattern as shown by the “red” triangle below. Whichever direction the market breaks out from this consolidation will dictate the direction of the next intermediate-term move.

I would be careful “betting” on an upside breakout at this juncture with the Fed, ECB, Japan and now the Trump Administration working at odds with the markets. But at the same time, getting excessively “bearish” isn’t prudent either.
Turning points in the market, if this is one, are extremely difficult to navigate. They are also the juncture where the most investing mistakes are made.
For now, it is important to note the “bullish trend” remains solidly intact. While “bearish signals”are certainly rising, the market has done nothing in the short-term except begin a short-term correction/consolidation process.
With the market still in the seasonally strong time of the year, there is a decent probability that the market attempts a continuation of its bullish advance.
However,it also doesn’t mean we are completely “out of the woods” just yet either. As I noted last week:
“There is a risk the market could reverse next week keeping prices confined within the bullish trend channel. A failure at the trend line, which would coincide with a break below the 50-dma, would likely lead to a retracement back to the 200-dma which is currently running along the bottom of the bullish-trend channel.”
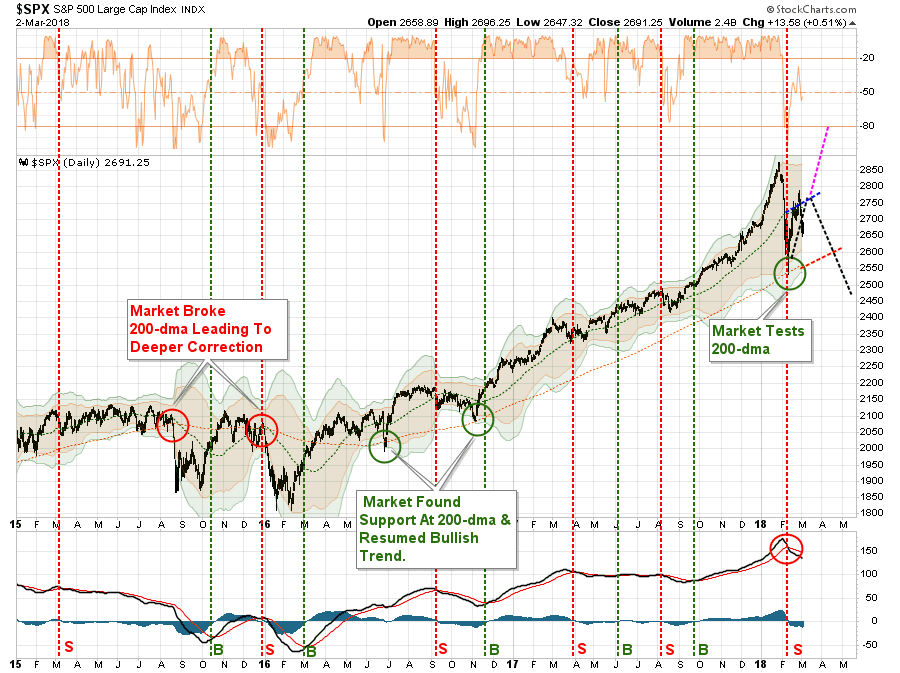
So far, that is exactly what has happened. As noted in the chart above, the market broke through the 50-dma and is currently testing support at the 100-dma. Let’s review what we said last week:
On the bearish side, a failure at current resistance levels would likely lead to a retracement to the 200-dma. Such a correction would also trigger the MACD sell-signal which is already at historically high levels. That “sell signal” will put additional downward pressure on the market.
While the 200-dma has not been tested, yet, the breakdown did trigger the secondary sell-signal as expected. As such we reduced some equity exposure and add our short-hedge back to portfolios.
Here is what we are looking for next to determine our next course of actions.
- As long as the market holds at the rising bullish trend and 200-dma, the bullish backdrop remains intact keeping portfolios weighted towards equity exposure.
- However, if the market breaks below those “critical support” levels, as noted above, the risk of a deeper correction rises. Such a break will lead to increased hedging and a reduction of equity risk in our portfolio models.
- A break of that critical support will likely lead to a retest of the longer-term bullish trend around 2250 which would be a 22% decline from recent highs and an “official bear market.”
- A break below 2250 will likely coincide with the onset of the next recession and is an entirely different portfolio management strategy.
During the entirety of last week broadcasts, I consistently recommended cleaning up portfolios, reducing risk and paying attention.
Such has proven to salient advice so far.
If you didn’t see the guidelines we laid out for this process – click here.
It isn’t too late to take some actions next week as I suspect we could very likely see a further bounce on Monday or Tuesday.
Use that bounce wisely.
Charts To Watch
by Jesse Colombo
Here are the key U.S. stock charts to watch in the week ahead.
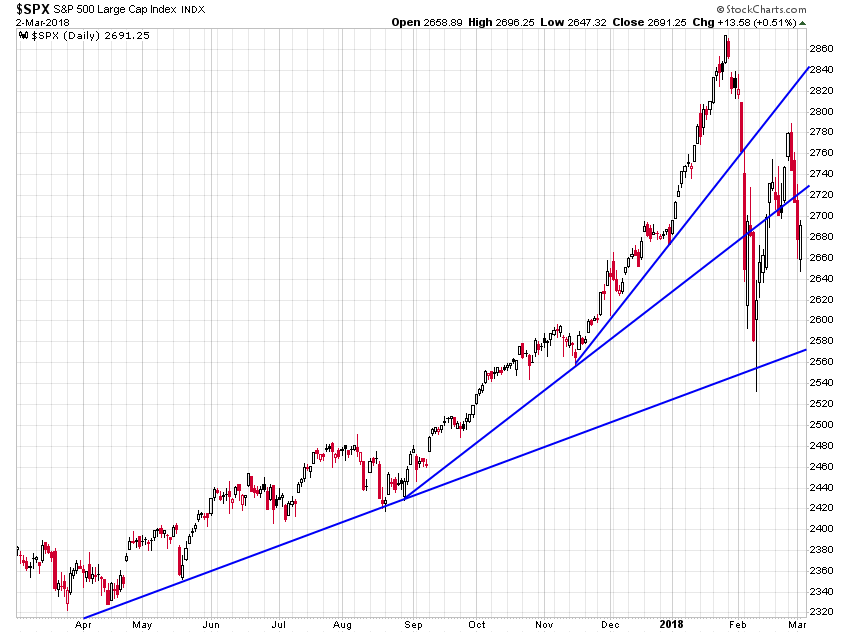
After breaking below the two most recent uptrend lines in early-February, the S&P 500 attempted to regain one of the trendlines earlier this week, but was unsuccessful and has fallen quite hard in the last several days. The market is currently bouncing around in between the most recent broken trendline and the longer-term trendline that is approximately 150 points below the current price. If the sell-off continues, this is the next most important price target and support level to watch which is currently at ~2,570.
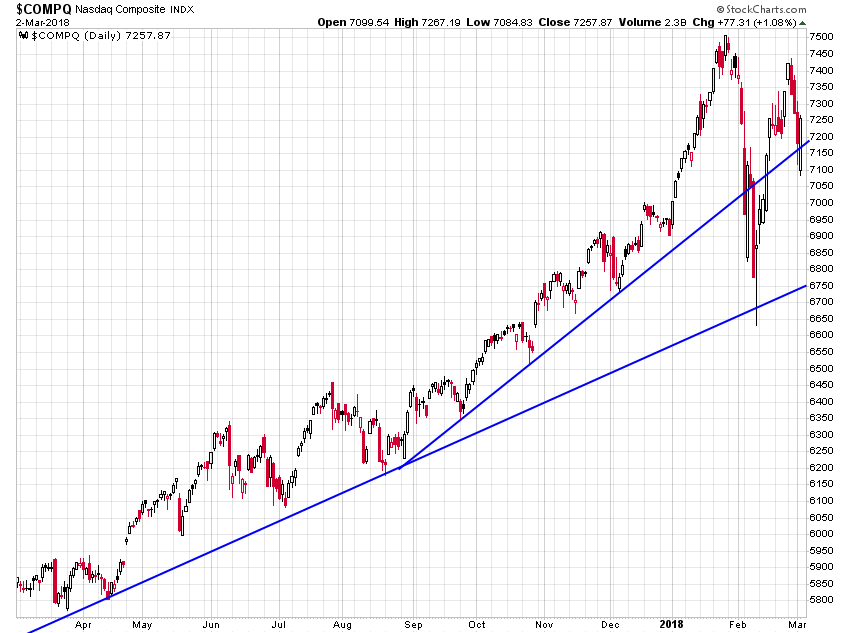
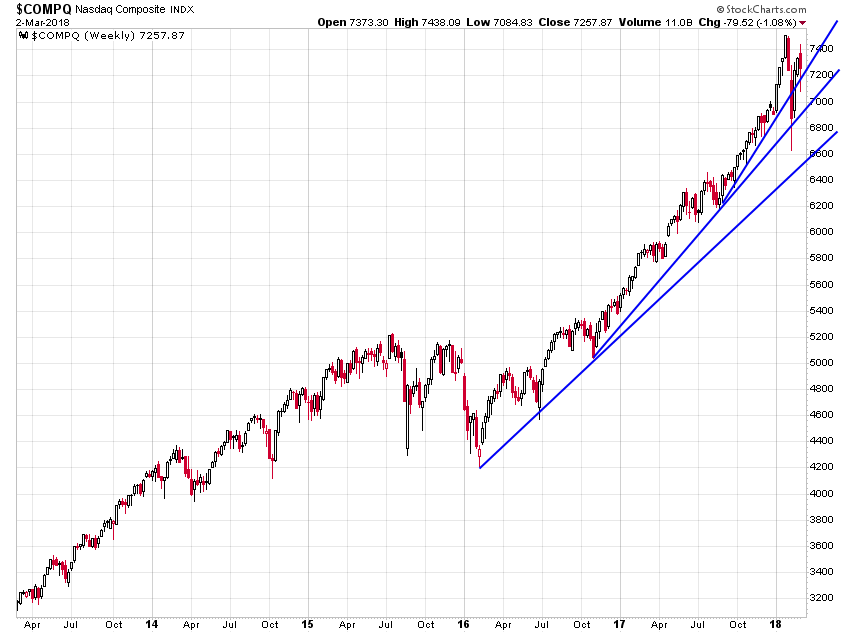
The daily Nasdaq Composite Index chart shows that the tech-heavy index is in a stronger technical position than the more industrially-oriented Dow and SP500. Though the Nasdaq broke below its most recent uptrend line in early-February, it was able to regain this level and has successfully remained above it despite a brief breakdown attempt on Thursday and Friday.
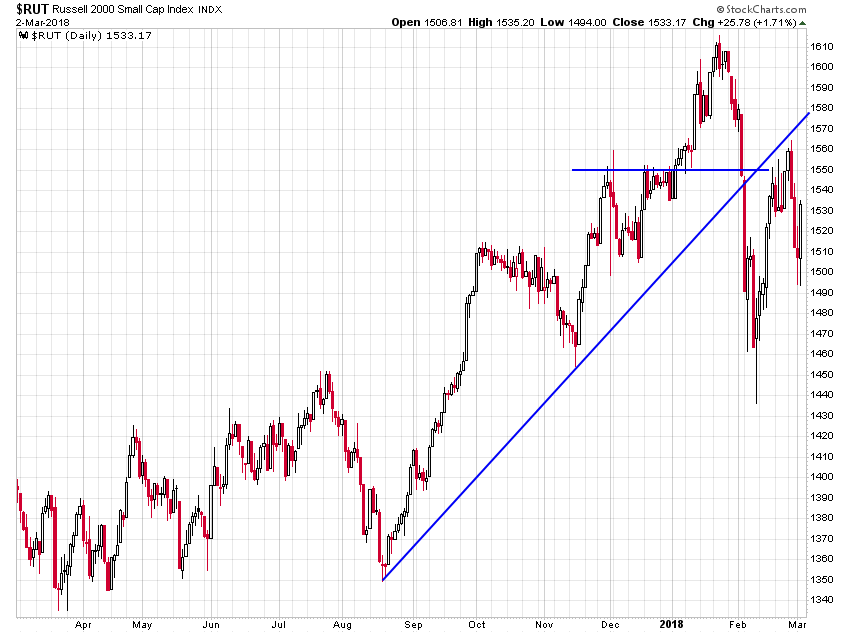
The small-cap Russell 2000 index is in the weakest technical position of all the major U.S. stock indices. The early-February market correction caused the Russell to slice below its uptrend line that started in August 2017, but it has been unable to regain this level despite the slight rebound that occurred in mid-February.
The weekly S&P 500 broke below its August 2017 uptrend line in early-February and has been unable to regain this level. If the sell-off continues, the uptrend line that began in early-2016 is the most important support level and price target to watch. If that level breaks in the future, it would be very worrisome.

The Nasdaq Composite remains above all of its major uptrend lines on the weekly chart, which confirms its relatively strong technical position. If the index breaks below these uptrend lines, however, the technical picture would become much more bearish.
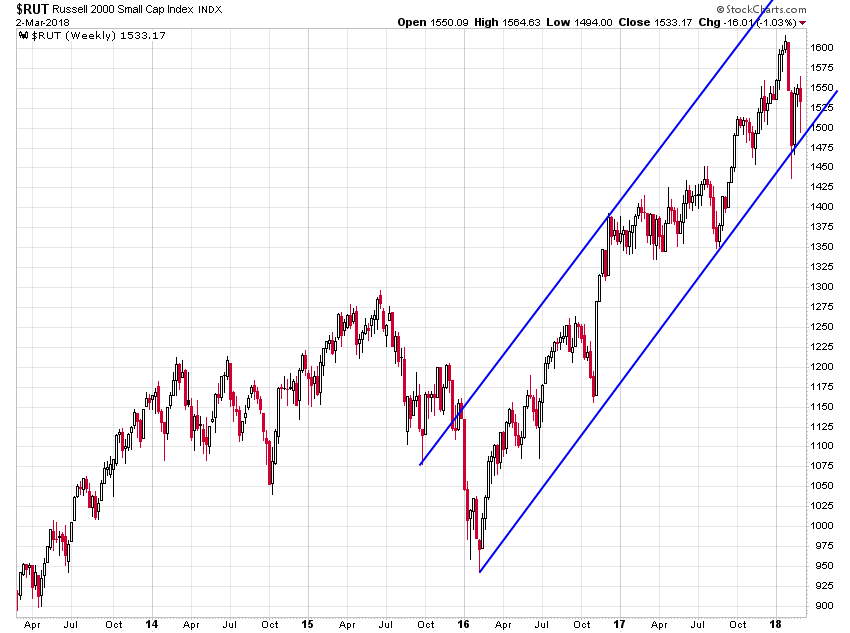
Despite the Russell 2000’s weak chart on the daily timescale, its weekly chart looks much stronger. The small-cap index is still trading in a clear channel pattern and the uptrend remains intact as long as it remains within this channel. If, however, the Russell breaks below this channel in the future, it would give a bearish technical signal.
Worried About Being All In Or Out?
by John Coumarianos
The S&P 500 Index just closed down 3.69% for the month of February. That’s not a shockingly bad monthly return, and the index was still up 1.83% for the year at the end of the month. But February was the first time the index posted a monthly decline after 15 straight months of gains – a previously unmatched stretch of such consistency.
And that has investors gripped with two contradictory and emotionally exhausting fears – 1. The market’s powerful multi-year run may be coming to an end. 2. Selling stocks might result in missing more gains. In this vein, the Wall Street Journal reported today on investors who have manipulated their allocations in radical ways in response to the market’s moves and their own fears. For example, Justin Beghly from Arkansas, sold all his stocks early in 2017 in response to President Trump’s election victory, only to buy them back later and white-knuckle it through the February decline.
What’s remarkable is that none of the investors interviewed – including those who had advisors presumably keeping them in steady allocations – talked about how much of their assets they had in stocks. It was as if their choices were 100% stocks or 0% stocks. In other words, their main question was: Should I be in or out? Similarly, I was speaking to an investor two weeks ago, who had all her stocks in one account and all her bonds in another account. Her overall allocation was roughly balanced, but all she could think and talk about were her stocks. It was as if the bonds didn’t exist.
Investors must undergo many changes before they stop buying high and selling low, but two of those changes must be to understand how much of their assets are in stocks; and to stop concentrating on their stocks alone. Another crucial change investors must make is to think longer-term. That’s because if the choice is between stocks and bonds, it’s much easier to estimate future long-term returns than future short-term returns.
As my colleague, Michael Lebowitz, argued recently, most of the time, answering the question of whether to own stocks or bonds isn’t easy. The answer depends on an investor’s time horizon, tolerance of volatility, and other things. And most investors should have enough stocks to feel as if they are participating in the market when it’s rising, and not destroying their portfolios when it’s declining. That’s not an easy balance to strike, but it’s the crucial work that investors must do either by themselves or with their advisors.
Now Michael says this time it’s easier than other times to exclude stocks becauseU.S. stocks are so overpriced that they may not beat bonds over the next decade. It’s very difficult for stocks to post robust returns from a starting Shiller PE (current price relative to the past decade’s worth of real, average earnings) of above 30.
I am sympathetic to Michael’s argument, and I am also reminded of Ben Graham’s definition of the “enterprising investor” in his book The Intelligent Investor. Graham distinguished between someone who maintained a steady balanced allocation – a “defensive” investor – and someone who studied the markets hard, and manipulated his allocation accordingly – the “enterprising” investor. Graham thought the enterprising investor mush put in great effort to warrant the allocation manipulation he did. Graham also thought most enterprising investors should operate portfolios whose stock exposure landed between 75% and 25%.
(Importantly, this is the method all models at our firm are managed as equity exposure, as noted in the 401k Plan Manager below, is ratcheted up, and down, in 25% increments with equity never falling below 25% of target allocations.)
In other words, 100% and 0% were too extreme for Graham to recommend even to a savvy student of the markets. If you own no stocks, and the market keeps racing, you may foolishly buy some stocks at higher and higher prices. Better to own some now at admittedly high prices, because that might prevent you from buying at still higher prices. Also, better to peak at 75% stock exposure on the way down. That’s because if the market keeps declining after you get to 75%, at least not all of your money is exposed to falling prices.
Ordinary investors today, fret about being fully exposed or not exposed at all to stocks, when one of the greatest students of the markets and investing counseled only the most sophisticated investors to toggle between 75% and 25% stock exposure. Most others should stick to a static allocation, which, of course, means rebalancing from time to time. And rebalancing means selling stocks gently as they’re going up, and buying them gently as they’re going down. The first step to being an intelligent investor is to lose the all-in or all-out mindset.
Market & Sector Analysis
Data Analysis Of The Market & Sectors For Traders
S&P 500 Tear Sheet
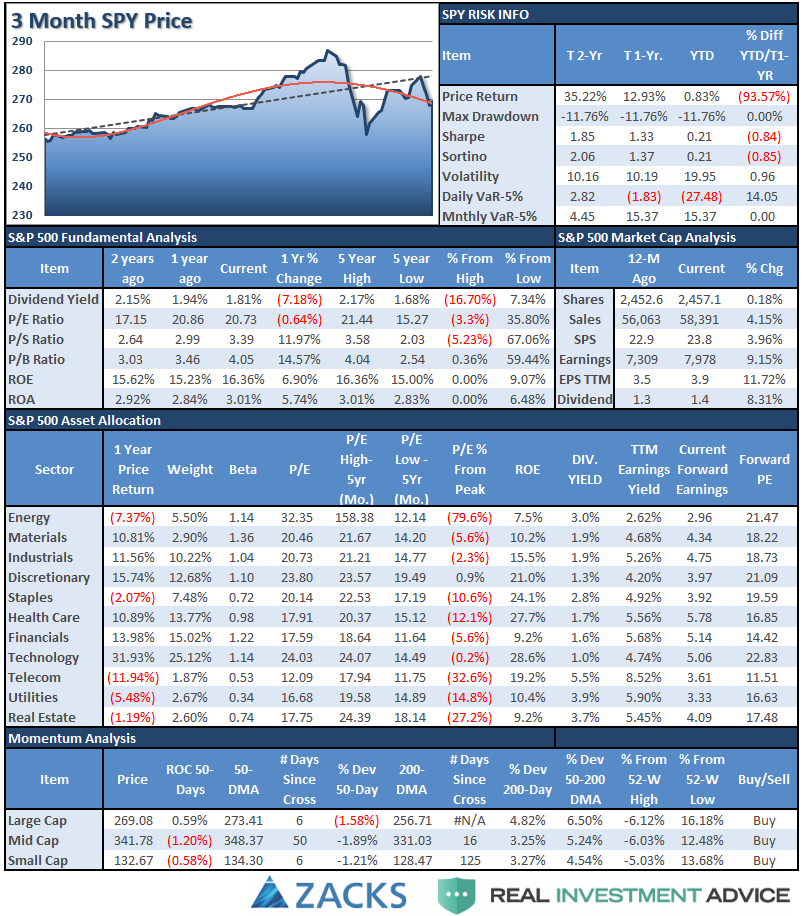
Performance Analysis
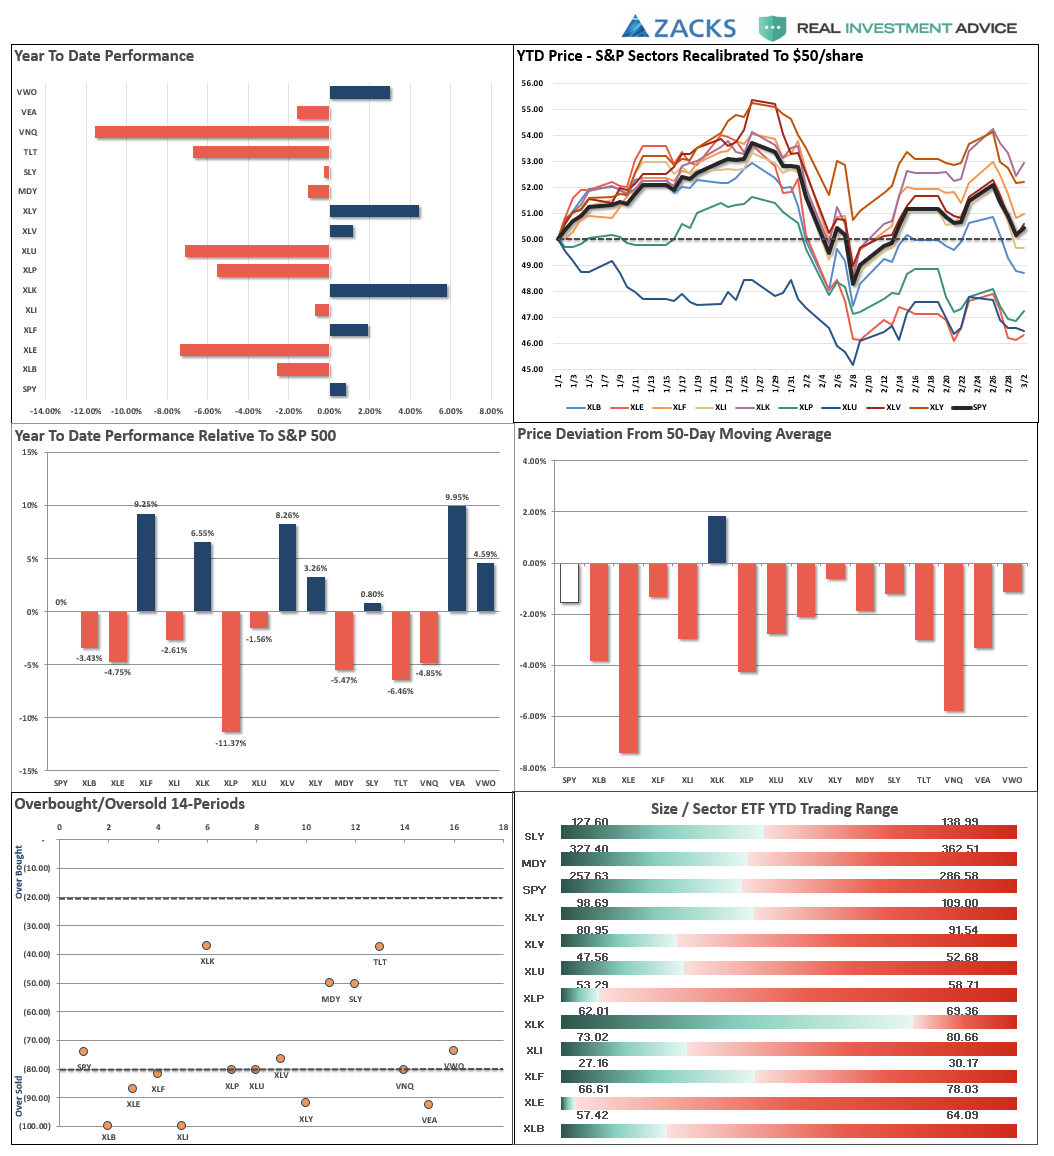
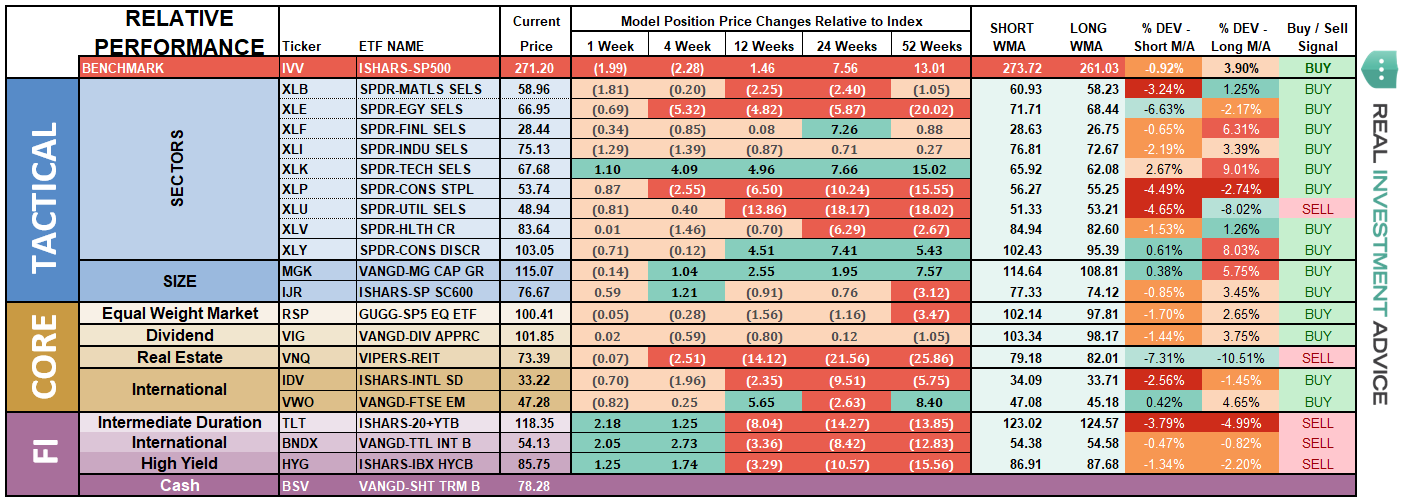
ETF Model Relative Performance Analysis
Sector & Market Analysis:
As I noted last week, the market failed at the intermediate-term bullish trend line. This now reinforces that resistance level and with the break below the 50-dma raises the downward pressure on stocks in the short-term. We had laid out two possible trajectories previously based on these support and resistance levels. I have updated the chart through Friday.
With the failure at resistance, and combined with the initiation of a “sell signal,” we did add our short-hedge back to portfolios and reduced overweight exposure to “tariff sensitive” sectors of Energy, Industrials, and Materials.
Let’s review.

Discretionary, Industrials, Materials, Health Care and Financials broke back through their respective 50-dma. While bullish trends remain clearly intact, these sectors remain overbought currently on a short-term basis and could see additional pressure next week. If you haven’t taken profits, this is a good time to do so.
Technology held support at the 50-dma, however, the sector could be in a very early topping process so taking profits and rebalancing risk here is highly advisable.
Energy – we were stopped out of our small additional Energy trade with the break back below the 200-dma this past week. I am going to write an update on oil here soon, but the bearish developments in oil suggest lower prices for energy-related stocks.
Staples and Utilities have continued to underperform in recent weeks. With the sectors very oversold on a longer-term basis look for a potential rotation to reduce weightings into for now. I suspect the opportunity for these sectors to shine is coming as the realization of weaker economic growth and deflationary pressures become more visible.
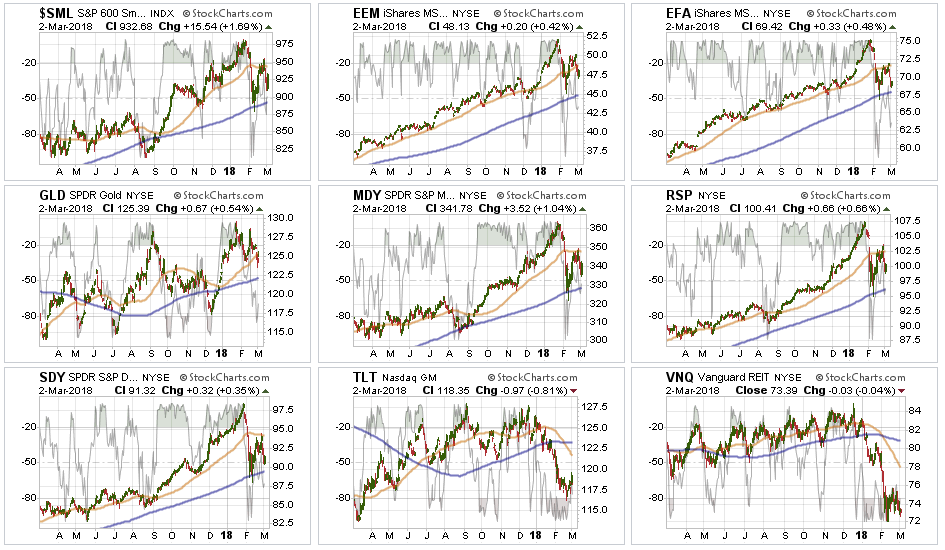
Small Cap, Mid Cap, Emerging Markets, International, Equal Weight, and Dividendindices all broke back through their 50-dma last week. We reduced weights in international exposure due to the likely impact to economic growth from “tariffs” on those markets. While all of these markets remain in bullish uptrends, for now, requiring exposure, there is short-term pressure to the downside so caution is advised.
Gold broke back below its 50-dma on Friday and has recently put in a “double top” further reinforcing overhead resistance from last September. We currently do not have exposure to gold, but if you are already long the metal, the backdrop overall remains bullish but a correctional phase may be approaching so taking profits is likely wise.
Bonds and REITs over the last couple of weeks, these two sectors looked to have bottomed and initiated early “buy” signals. Hold positions for now as interest rates have started to recognize the economic weakness that has shown up in the data as of late.
Sector Recommendations:
The table below shows thoughts on specific actions related to the current market environment.
(These are not recommendations or solicitations to take any action. This is for informational purposes only related to market extremes and contrarian positioning within portfolios. Use at your own risk and peril.)

Portfolio Update:
On Friday, as the market failed at the 50-dma for the week, we added our “short market hedge” back into portfolios. The position is not a “bearish bet” on the market, but rather a “volatility reduction” of our portfolio longs. With the market back below the 50-dma, and the failure at the intermediate-term bullish trend line, combined with the initiation of a “weekly confirmed sell-signal,” we are reducing some equity exposure and raising cash levels in portfolios temporarily.
Next week, I expect we could see a follow through bounce from Friday’s late day recovery but we will look to further rebalance positions as necessary. If the market breaks the 100-dma, which held on Friday, the market will likely retest the 200-dma and further deteriorate the underlying bullish technicals.
As noted last week:
“Furthermore, the risk of a continuing corrective process remains which keeps us vigilant.Currently, everything remains within our longer-term tolerance bands for risk controls. While corrections certainly do not ‘feel’ good, it is important we don’t let short-term pickups in volatility derail longer-term investment strategies.”
While most positions still remain within their bullish tolerance bands, the deterioration in the markets shorter-term is concerning. We simply advise being alert to current market developments.
THE REAL 401k PLAN MANAGER
The Real 401k Plan Manager – A Conservative Strategy For Long-Term Investors
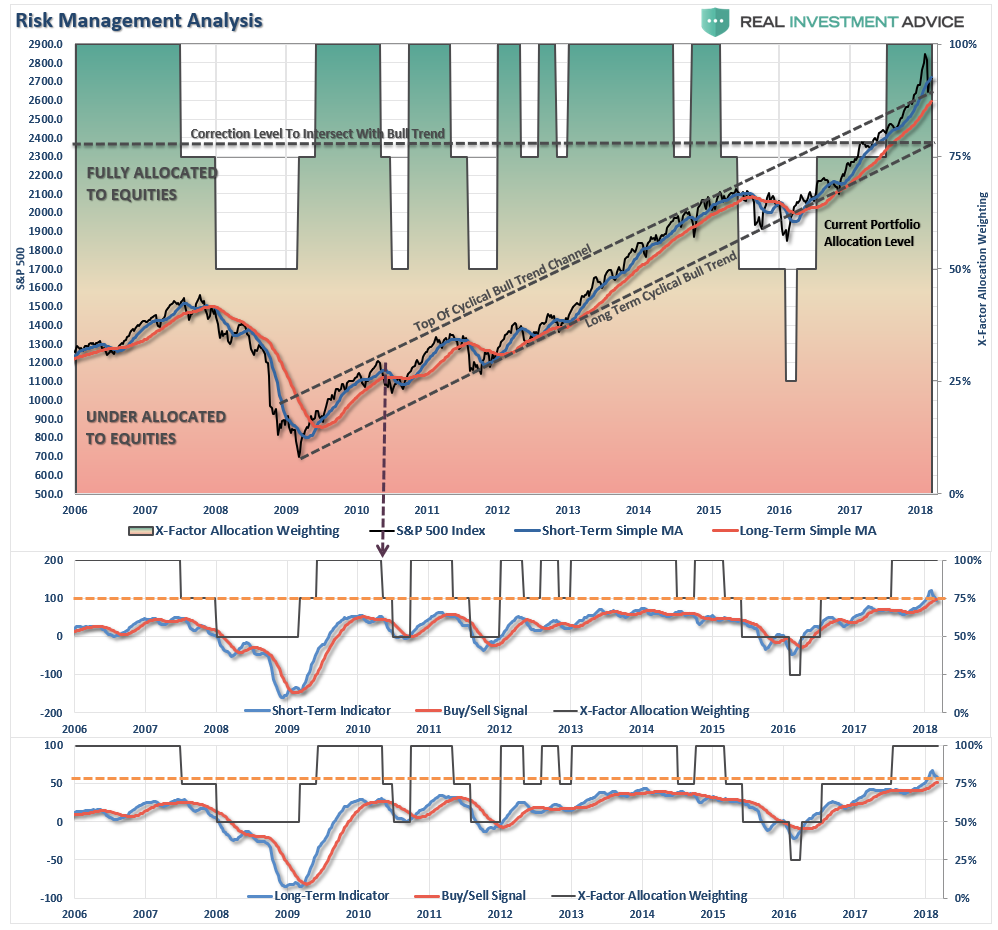
There are 4-steps to allocation changes based on 25% reduction increments. As noted in the chart above a 100% allocation level is equal to 60% stocks. I never advocate being 100% out of the market as it is far too difficult to reverse course when the market changes from a negative to a positive trend. Emotions keep us from taking the correct action.

Signals Trip – Early Caution
Last week I stated:
“The current correction has only retraced to the top of the longer-term upper bullish trend line. As I have discussed previously, the massive extension above the longer-term trends HAD to be corrected. Furthermore, BOTH of the lower indicators remain firmly on ‘buy’ signalswhich keeps allocations weighted to the long-side.”
That changed this past week with the reversal of the recent rally. While the market remains confined to the bullish trend currently, the “warning” signs have escalated over the past week.
As I also stated:
“While the recent correction could have been, and potentially still could be, the beginning of a larger corrective process, so far it hasn’t been the case…How the market performs over the next week, or two, will determine our next major course of action.”
With the broader action of the market still bullish, we do not want to start making drastic changes as of yet. However, “alerts” have gone up and we are a bit more defensive now than previously. Continue to rebalance bond holdings back to target allocations but continue adding All NEW contributions to cash or cash equivalents.
If this correction completes, without violating any underlying bullish trends, we will use accumulated funds opportunistically to rebalance equity weightings.If the market violates the bullish narrative, we will begin reducing overall equity related exposure.
Current 401-k Allocation Model
The 401k plan allocation plan below follows the K.I.S.S. principle. By keeping the allocation extremely simplified it allows for better control of the allocation and a closer tracking to the benchmark objective over time. (If you want to make it more complicated you can, however, statistics show that simply adding more funds does not increase performance to any great degree.)
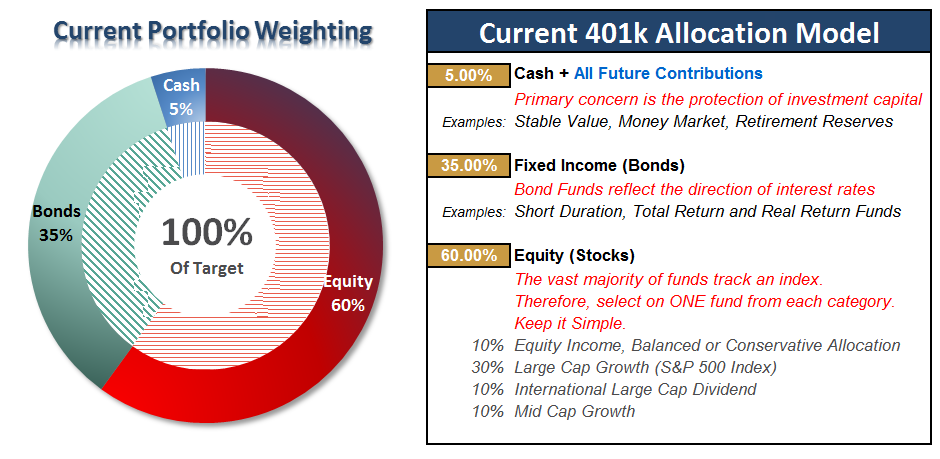
401k Choice Matching List
The list below shows sample 401k plan funds for each major category. In reality, the majority of funds all track their indices fairly closely. Therefore, if you don’t see your exact fund listed, look for a fund that is similar in nature.

Disclosure: The information contained in this article should not be construed as financial or investment advice on any subject matter. Real Investment Advice is expressly disclaims all liability in ...
more

